
Page 83 - Biomedical Engineering and Design Handbook Volume 1, Fundamentals
P. 83
60 BIOMECHANICS OF THE HUMAN BODY
muscle. Blood flow in the tumor and normal tissue may also be quite different because of different
vasculatures. Contrary to the general notion that blood flow is less in tumors than in normal tissues,
blood flow in many tumors, particularly in small tumors, is actually greater than that in surrounding
normal tissues at normothermic conditions. Even in the same tumor, blood flow generally decreases
as the tumor grows larger, owing partially to progressive deterioration of vascular beds and to the
rapid growth of tumor cell population relative to vascular bed.
The dynamic responses of the blood flow to hyperthermia in normal tissue and tumors are even
more diversified than the blood flow heterogeneity. It is a well-known fact that heat induces a prompt
increase in blood flow accompanied by dilation of vessels and an increase in permeability of the
vascular wall in normal tissues. The degree of pathophysiological changes in the vascular system in
normal tissue is, of course, dependent on the heating temperature, the heating duration, and the
heating protocol. Experimental study by Song (1984) has shown how the vasculature changed in the
skin and muscle of rodents at different time intervals after hyperthermia for varying heating temper-
atures at 42 to 45°C. It was shown that the blood flow in the skin increased by a factor of 4 and 6
upon heating at 43°C for 60 and 120 minutes, respectively. At 44°C the skin blood flow was about
12 times the control value within 30 minutes. At high heating temperature, there existed a critical
time after which the blood flow decreased because of vasculature damage. This critical time was
more quickly reached when the heating temperature was higher. The blood flow increase in the muscle
was similar to that observed in the skin layer, a tenfold increase in the blood flow was noticed at the
45°C heating.
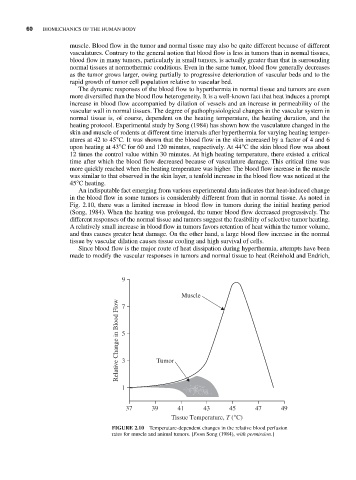
An indisputable fact emerging from various experimental data indicates that heat-induced change
in the blood flow in some tumors is considerably different from that in normal tissue. As noted in
Fig. 2.10, there was a limited increase in blood flow in tumors during the initial heating period
(Song, 1984). When the heating was prolonged, the tumor blood flow decreased progressively. The
different responses of the normal tissue and tumors suggest the feasibility of selective tumor heating.
A relatively small increase in blood flow in tumors favors retention of heat within the tumor volume,
and thus causes greater heat damage. On the other hand, a large blood flow increase in the normal
tissue by vascular dilation causes tissue cooling and high survival of cells.
Since blood flow is the major route of heat dissipation during hyperthermia, attempts have been
made to modify the vascular responses in tumors and normal tissue to heat (Reinhold and Endrich,
9
Muscle
Relative Change in Blood Flow 5 Tumor
7
3
1
37 39 41 43 45 47 49
Tissue Temperature, T (°C)
FIGURE 2.10 Temperature-dependent changes in the relative blood perfusion
rates for muscle and animal tumors. [From Song (1984), with permission.]