
Page 82 - Biomedical Engineering and Design Handbook Volume 1, Fundamentals
P. 82
HEAT TRANSFER APPLICATIONS IN BIOLOGICAL SYSTEMS 59
40
38
36
Temperature (°C) 32
34
30
28
26
24
22
20
–2 0 2 4 6 8 10 12 14 16 18 20
Time (minute)
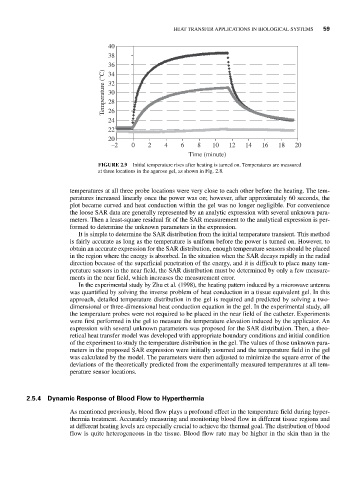
FIGURE 2.9 Initial temperature rises after heating is turned on. Temperatures are measured
at three locations in the agarose gel, as shown in Fig. 2.8.
temperatures at all three probe locations were very close to each other before the heating. The tem-
peratures increased linearly once the power was on; however, after approximately 60 seconds, the
plot became curved and heat conduction within the gel was no longer negligible. For convenience
the loose SAR data are generally represented by an analytic expression with several unknown para-
meters. Then a least-square residual fit of the SAR measurement to the analytical expression is per-
formed to determine the unknown parameters in the expression.
It is simple to determine the SAR distribution from the initial temperature transient. This method
is fairly accurate as long as the temperature is uniform before the power is turned on. However, to
obtain an accurate expression for the SAR distribution, enough temperature sensors should be placed
in the region where the energy is absorbed. In the situation when the SAR decays rapidly in the radial
direction because of the superficial penetration of the energy, and it is difficult to place many tem-
perature sensors in the near field, the SAR distribution must be determined by only a few measure-
ments in the near field, which increases the measurement error.
In the experimental study by Zhu et al. (1998), the heating pattern induced by a microwave antenna
was quantified by solving the inverse problem of heat conduction in a tissue equivalent gel. In this
approach, detailed temperature distribution in the gel is required and predicted by solving a two-
dimensional or three-dimensional heat conduction equation in the gel. In the experimental study, all
the temperature probes were not required to be placed in the near field of the catheter. Experiments
were first performed in the gel to measure the temperature elevation induced by the applicator. An
expression with several unknown parameters was proposed for the SAR distribution. Then, a theo-
retical heat transfer model was developed with appropriate boundary conditions and initial condition
of the experiment to study the temperature distribution in the gel. The values of those unknown para-
meters in the proposed SAR expression were initially assumed and the temperature field in the gel
was calculated by the model. The parameters were then adjusted to minimize the square error of the
deviations of the theoretically predicted from the experimentally measured temperatures at all tem-
perature sensor locations.
2.5.4 Dynamic Response of Blood Flow to Hyperthermia
As mentioned previously, blood flow plays a profound effect in the temperature field during hyper-
thermia treatment. Accurately measuring and monitoring blood flow in different tissue regions and
at different heating levels are especially crucial to achieve the thermal goal. The distribution of blood
flow is quite heterogeneous in the tissue. Blood flow rate may be higher in the skin than in the