
Page 176 - Biomedical Engineering and Design Handbook Volume 2, Applications
P. 176
DESIGN OF ARTIFICIAL KIDNEYS 155
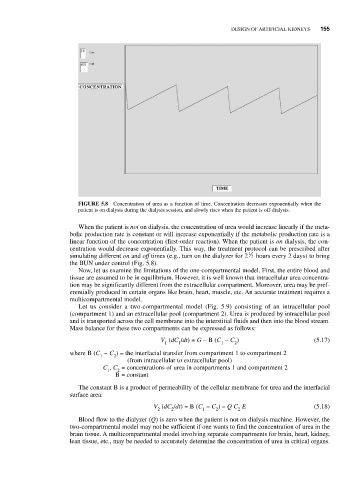
FIGURE 5.8 Concentration of urea as a function of time. Concentration decreases exponentially when the
patient is on dialysis during the dialysis session, and slowly rises when the patient is off-dialysis.
When the patient is not on dialysis, the concentration of urea would increase linearly if the meta-
bolic production rate is constant or will increase exponentially if the metabolic production rate is a
linear function of the concentration (first-order reaction). When the patient is on dialysis, the con-
centration would decrease exponentially. This way, the treatment protocol can be prescribed after
1
simulating different on and off times (e.g., turn on the dialyzer for 2 2 hours every 2 days) to bring
the BUN under control (Fig. 5.8).
Now, let us examine the limitations of the one-compartmental model. First, the entire blood and
tissue are assumed to be in equilibrium. However, it is well known that intracellular urea concentra-
tion may be significantly different from the extracellular compartment. Moreover, urea may be pref-
erentially produced in certain organs like brain, heart, muscle, etc. An accurate treatment requires a
multicompartmental model.
Let us consider a two-compartmental model (Fig. 5.9) consisting of an intracellular pool
(compartment 1) and an extracellular pool (compartment 2). Urea is produced by intracellular pool
and is transported across the cell membrane into the interstitial fluids and then into the blood stream.
Mass balance for these two compartments can be expressed as follows:
V (dC /dt) = G – B (C – C ) (5.17)
1 1 1 2
where B (C − C ) = the interfacial transfer from compartment 1 to compartment 2
1 2
(from intracellular to extracellular pool)
C , C = concentrations of urea in compartments 1 and compartment 2
1 2
B = constant
The constant B is a product of permeability of the cellular membrane for urea and the interfacial
surface area:
V (dC /dt) = B (C – C ) – QC E (5.18)
2 2 1 2 2
Blood flow to the dialyzer (Q) is zero when the patient is not on dialysis machine. However, the
two-compartmental model may not be sufficient if one wants to find the concentration of urea in the
brain tissue. A multicompartmental model involving separate compartments for brain, heart, kidney,
lean tissue, etc., may be needed to accurately determine the concentration of urea in critical organs.