
Page 106 - Biosystems Engineering
P. 106
Biosystems Analysis and Optimization 87
1600 60 6
Engine speed (rpm) 1500 40 Pump setting (%) Machine speed (km h –1 ) 4 2
1400
1300 20 0
0 5 10 15 0 5 10 15
Time (s) Time (s)
(a) (b)
1600 60
6
Engine speed (rpm) 1500 40 Pump setting (%) Speed (km h –1 ) 4 2
1400
1300 20 0
0 5 10 15 0 5 10 15
Time (s) Time (s)
(c) (d)
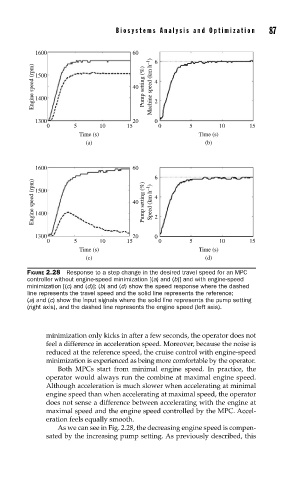
FIGURE 2.28 Response to a step change in the desired travel speed for an MPC
controller without engine-speed minimization [(a) and (b)] and with engine-speed
minimization [(c) and (d)]; (b) and (d) show the speed response where the dashed
line represents the travel speed and the solid line represents the reference;
(a) and (c) show the input signals where the solid line represents the pump setting
(right axis), and the dashed line represents the engine speed (left axis).
minimization only kicks in after a few seconds, the operator does not
feel a difference in acceleration speed. Moreover, because the noise is
reduced at the reference speed, the cruise control with engine-speed
minimization is experienced as being more comfortable by the operator.
Both MPCs start from minimal engine speed. In practice, the
operator would always run the combine at maximal engine speed.
Although acceleration is much slower when accelerating at minimal
engine speed than when accelerating at maximal speed, the operator
does not sense a difference between accelerating with the engine at
maximal speed and the engine speed controlled by the MPC. Accel-
eration feels equally smooth.
As we can see in Fig. 2.28, the decreasing engine speed is compen-
sated by the increasing pump setting. As previously described, this