
Page 117 - Biosystems Engineering
P. 117
98 Cha pte r T h ree
water and moving the other bucket beneath the outlet of the funnel.
The time at which the bucket tips is recorded.
The U.S. National Weather Service employs a network of 158 opera-
tional Doppler radars, called Next Generation Radar (NEXRAD) to gen-
erate spatially distributed precipitation data for the entire United States
(also called Weather Surveillance Radar 88 Doppler, WSR-88D). Indi-
vidual radars send signals and measure reflectivity of raindrops, snow,
and other forms of precipitation. These reflectivity measures are then
converted to precipitation using various algorithms. Precipitation esti-
mates from an individual radar is called Level I product. The maximum
range of these radars is up to 250 miles. Therefore the service areas of
individual radars often overlap. In Level II products precipitation esti-
mates from several radars are combined to create a mosaic of precipita-
tion estimates. These mosaics of spatially varied precipitation data are
further improved with data from local rain gauges to produce Level III
products. Level III products are also combined for the entire contermi-
nous United States to produce “CONUS” NEXRAD products.
3.3.2 Mean Areal Rainfall Depth
There are two methods of estimating mean areal rainfall depth from
rain gauges: The Thiessen polygon method and the isohyetal method. The
former is much simpler and easier to apply. The latter is more accu-
rate, however, it requires more data.
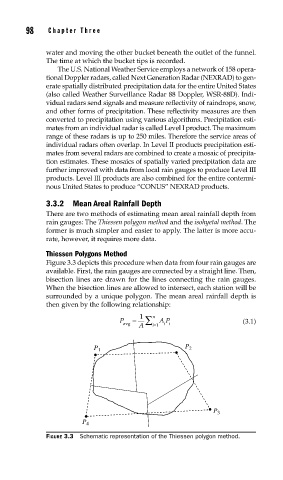
Thiessen Polygons Method
Figure 3.3 depicts this procedure when data from four rain gauges are
available. First, the rain gauges are connected by a straight line. Then,
bisection lines are drawn for the lines connecting the rain gauges.
When the bisection lines are allowed to intersect, each station will be
surrounded by a unique polygon. The mean areal rainfall depth is
then given by the following relationship:
1
P avg = ∑ n AP (3.1)
ii
A i=1
P 1 P 2
P 3
P 4
FIGURE 3.3 Schematic representation of the Thiessen polygon method.