
Page 118 - Biosystems Engineering
P. 118
Soil and W ater Conservation 99
where P is the mean areal precipitation, A is the total area of the
avg
region (e.g., watershed), A is the area of the polygon encompassing
i
station i, P is the rainfall depth at station i, and n is the total number
i
of rain gauges.
Isohyetal Method
An isohyetal map is a map showing lines of equal precipitation (iso-
hyets) similar to contour lines in a topographic map.
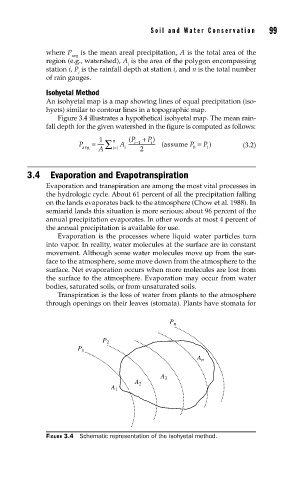
Figure 3.4 illustrates a hypothetical isohyetal map. The mean rain-
fall depth for the given watershed in the figure is computed as follows:
1 n ( P + )
P
i
i−1
P = ∑ A ( assume P = P ) (3.2)
avg A i=1 i 2 0 1
3.4 Evaporation and Evapotranspiration
Evaporation and transpiration are among the most vital processes in
the hydrologic cycle. About 61 percent of all the precipitation falling
on the lands evaporates back to the atmosphere (Chow et al. 1988). In
semiarid lands this situation is more serious; about 96 percent of the
annual precipitation evaporates. In other words at most 4 percent of
the annual precipitation is available for use.
Evaporation is the processes where liquid water particles turn
into vapor. In reality, water molecules at the surface are in constant
movement. Although some water molecules move up from the sur-
face to the atmosphere, some move down from the atmosphere to the
surface. Net evaporation occurs when more molecules are lost from
the surface to the atmosphere. Evaporation may occur from water
bodies, saturated soils, or from unsaturated soils.
Transpiration is the loss of water from plants to the atmosphere
through openings on their leaves (stomata). Plants have stomata for
P n
P 2
P 1
A n
A 3
A 2
A 1
FIGURE 3.4 Schematic representation of the isohyetal method.