
Page 178 - Biosystems Engineering
P. 178
Models for Heat Transfer in Heated Substrates 157
heating cable and the reference plane causes greater difficulty for the
heating system to reach the target temperature, even for higher tem-
peratures of the heating cable. Similarly, as with depth, increased
spacing results in an increase in the number of times the heating system
is switched on.
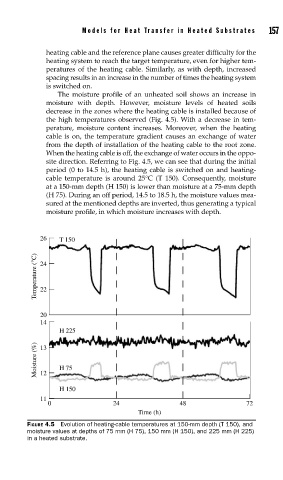
The moisture profile of an unheated soil shows an increase in
moisture with depth. However, moisture levels of heated soils
decrease in the zones where the heating cable is installed because of
the high temperatures observed (Fig. 4.5). With a decrease in tem-
perature, moisture content increases. Moreover, when the heating
cable is on, the temperature gradient causes an exchange of water
from the depth of installation of the heating cable to the root zone.
When the heating cable is off, the exchange of water occurs in the oppo-
site direction. Referring to Fig. 4.5, we can see that during the initial
period (0 to 14.5 h), the heating cable is switched on and heating-
cable temperature is around 25°C (T 150). Consequently, moisture
at a 150-mm depth (H 150) is lower than moisture at a 75-mm depth
(H 75). During an off period, 14.5 to 18.5 h, the moisture values mea-
sured at the mentioned depths are inverted, thus generating a typical
moisture profile, in which moisture increases with depth.
26 T 150
Temperature (°C) 24
22
20
14
H 225
Moisture (%) 13 H 75
12
H 150
11
0 24 48 72
Time (h)
FIGURE 4.5 Evolution of heating-cable temperatures at 150-mm depth (T 150), and
moisture values at depths of 75 mm (H 75), 150 mm (H 150), and 225 mm (H 225)
in a heated substrate.