
Page 41 - Biosystems Engineering
P. 41
22 Cha pte r O n e
Linear equations attempt to solve a weight matrix that represents a
series of linear equations of the expression level of each gene as a func-
tion of the other genes. Unfortunately, there need to be as many time
points as there are genes to develop a unique solution. When there is no
unique solution, we cannot know if the model derived from a linear
equation is correct. Differential equations model the expression level of
genes as a function of other genes and their rates of change. The solution
involves itself in solving for the constants in the differential equations.
Unfortunately, this suffers from the same problem as linear equations.
Boolean networks assume that genes are either “on” or “off” and attempt
to solve the state transitions for the system. Assuming that genes are
only in one of two states, however, is an oversimplification, although
methods have been developed to get around the simplification.
Woolf and Wang (2000) introduced an approach based on fuzzy rules
of a known activator/repressor model of gene interaction. Their algo-
rithm transforms expression values into qualitative descriptors that can
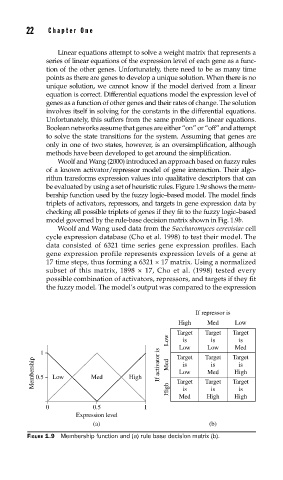
be evaluated by using a set of heuristic rules. Figure 1.9a shows the mem-
bership function used by the fuzzy logic–based model. The model finds
triplets of activators, repressors, and targets in gene expression data by
checking all possible triplets of genes if they fit to the fuzzy logic–based
model governed by the rule-base decision matrix shown in Fig. 1.9b.
Woolf and Wang used data from the Saccharomyces cerevisiae cell
cycle expression database (Cho et al. 1998) to test their model. The
data consisted of 6321 time series gene expression profiles. Each
gene expression profile represents expression levels of a gene at
17 time steps, thus forming a 6321 × 17 matrix. Using a normalized
subset of this matrix, 1898 × 17, Cho et al. (1998) tested every
possible combination of activators, repressors, and targets if they fit
the fuzzy model. The model’s output was compared to the expression
If repressor is
High Med Low
Target Target Target
Low is is is
Med
Low
Low
1 Target Target Target
Membership 0.5 Low Med High If activator is Med Target Target Target
is
is
is
Med
Low
High
High
is
is
is
Med High High
0 0.5 1
Expression level
(a) (b)
FIGURE 1.9 Membership function and (a) rule base decision matrix (b).