
Page 42 - Biosystems Engineering
P. 42
Micr oarray Data Analysis Using Machine Learning Methods 23
level of the corresponding target gene. Gene combinations were
ranked based on the residual between the model and the target gene
and variance between the applications of the fuzzy rules over the given
time series. Those combinations of genes that have a low error and
cover most of the fuzzy rule base were inferred to exhibit an activator–
repressor–target relationship. This method attempts to simulate
what a human would do in comparing expression levels of genes to
find the underlying relationships. Different fuzzy models can be
developed for different models of interaction, including coactiva-
tors and corepressors as well as the presence of other factors in the
cell, such as proteins or assorted compounds necessary for tran-
scription. This method is intuitively pleasing, and the results are
consistent with the literature of genetic networks of S. cerevisiae. The
model itself is an interesting generalization of Boolean networks
where genes are not either “on” or “off” but are often both “on” and
“off” at the same time. This approach, although logical, is a brute
force technique for finding gene relationships. It involves a signifi-
cant computation time, which restricts its practical usefulness. It has
3
an algorithmic complexity of N where N is the number of genes
analyzed. Furthermore, the model does not scale well to more com-
plex gene interactions. Building a model that includes two activa-
tors and two repressors would increase the algorithmic complexity
5
to N , making the analysis of 1898 genes not feasible. Also, Ressom
et al. (2003a) showed that Woolf and Wang’s model is susceptible
to noise.
Ressom et al. (2003a) investigated the use of clustering as an
interface to Woolf and Wang’s method to improve its computational
efficiency. This integrated approach significantly reduced the total
number of gene combinations to be tested by first analyzing how well
cluster centers fit the model. The algorithm ignores combinations of
genes whose cluster centers are unlikely to fit, thereby gaining sig-
nificant advantage over Woolf and Wang’s approach in reducing
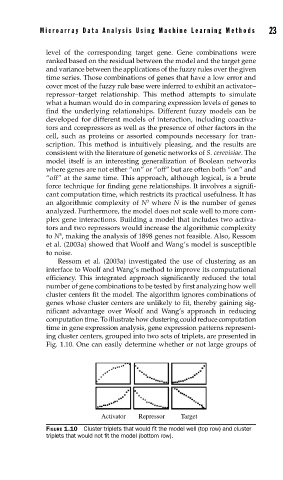
computation time. To illustrate how clustering could reduce computation
time in gene expression analysis, gene expression patterns represent-
ing cluster centers, grouped into two sets of triplets, are presented in
Fig. 1.10. One can easily determine whether or not large groups of
Activator Repressor Target
FIGURE 1.10 Cluster triplets that would fi t the model well (top row) and cluster
triplets that would not fi t the model (bottom row).