
Page 467 - Biosystems Engineering
P. 467
Exogenous Bior egulators–Fruit Composition & Storability 439
15.5.1 Apple Size
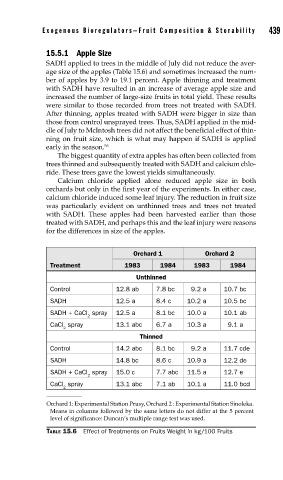
SADH applied to trees in the middle of July did not reduce the aver-
age size of the apples (Table 15.6) and sometimes increased the num-
ber of apples by 3.9 to 19.1 percent. Apple thinning and treatment
with SADH have resulted in an increase of average apple size and
increased the number of large-size fruits in total yield. These results
were similar to those recorded from trees not treated with SADH.
After thinning, apples treated with SADH were bigger in size than
those from control unsprayed trees. Thus, SADH applied in the mid-
dle of July to McIntosh trees did not affect the beneficial effect of thin-
ning on fruit size, which is what may happen if SADH is applied
early in the season. 56
The biggest quantity of extra apples has often been collected from
trees thinned and subsequently treated with SADH and calcium chlo-
ride. These trees gave the lowest yields simultaneously.
Calcium chloride applied alone reduced apple size in both
orchards but only in the first year of the experiments. In either case,
calcium chloride induced some leaf injury. The reduction in fruit size
was particularly evident on unthinned trees and trees not treated
with SADH. These apples had been harvested earlier than those
treated with SADH, and perhaps this and the leaf injury were reasons
for the differences in size of the apples.
Orchard 1 Orchard 2
Treatment 1983 1984 1983 1984
Unthinned
Control 12.8 ab 7.8 bc 9.2 a 10.7 bc
SADH 12.5 a 8.4 c 10.2 a 10.5 bc
SADH + CaCl spray 12.5 a 8.1 bc 10.0 a 10.1 ab
2
CaCl spray 13.1 abc 6.7 a 10.3 a 9.1 a
2
Thinned
Control 14.2 abc 8.1 bc 9.2 a 11.7 cde
SADH 14.8 bc 8.6 c 10.9 a 12.2 de
SADH + CaCl spray 15.0 c 7.7 abc 11.5 a 12.7 e
2
CaCl spray 13.1 abc 7.1 ab 10.1 a 11.0 bcd
2
Orchard 1: Experimental Station Prusy, Orchard 2 : Experimental Station Sinoleka.
Means in columns followed by the same letters do not differ at the 5 percent
level of significance: Duncan’s multiple range test was used.
TABLE 15.6 Effect of Treatments on Fruits Weight in kg/100 Fruits