
Page 480 - Biosystems Engineering
P. 480
452 Cha pte r S i x tee n
(Dunford and Temelli 1996; Bauer et al. 2000), disruption of microbial
cells to aid extraction (Castor and Hong 1995), and pretreatment of
lignocellulosic substrates (Zheng et al. 1998; Kim and Hong 2001).
The mechanisms for these applications involve mechanical cell rup-
ture, chemical and biochemical modification of structure of the treated
sample and their synergistic effects, giving several advantages of
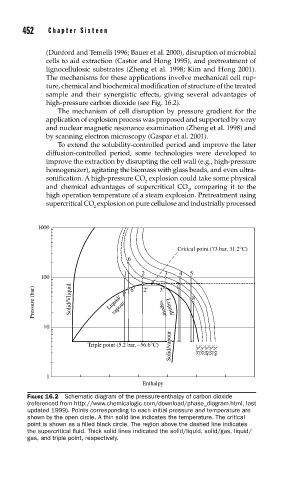
high-pressure carbon dioxide (see Fig. 16.2).
The mechanism of cell disruption by pressure gradient for the
application of explosion process was proposed and supported by x-ray
and nuclear magnetic resonance examination (Zheng et al. 1998) and
by scanning electron microscopy (Gaspar et al. 2001).
To extend the solubility-controlled period and improve the later
diffusion-controlled period, some technologies were developed to
improve the extraction by disrupting the cell wall (e.g., high-pressure
homogenizer), agitating the biomass with glass beads, and even ultra-
sonification. A high-pressure CO explosion could take some physical
2
and chemical advantages of supercritical CO , comparing it to the
2
high operation temperature of a steam explosion. Pretreatment using
supercritical CO explosion on pure cellulose and industrially processed
2
1000
Critical point (73 bar, 31.2°C)
6
1 2 3 4 5
100 6′ 2′ 3′ 7
Pressure (bar) Solid/Vliquid Liquid/ 1′ vapour Liquid/ 8
vapour
10
Solid/vapour 25°C 35°C 45°C 55°C 65°C
Triple point (5.2 bar, –56.6°C)
1
Enthalpy
FIGURE 16.2 Schematic diagram of the pressure-enthalpy of carbon dioxide
(referenced from http://www.chemicalogic.com/download/phase_diagram.html, last
updated 1999). Points corresponding to each initial pressure and temperature are
shown by the open circle. A thin solid line indicates the temperature. The critical
point is shown as a fi lled black circle. The region above the dashed line indicates
the supercritical fl uid. Thick solid lines indicated the solid/liquid, solid/gas, liquid/
gas, and triple point, respectively.