
Page 28 - Boiler_Operators_Handbook,_Second_Edition
P. 28
Operating Wisely 13
outdoor air temperature and oil consumption for several
hours then produced that data at our next meeting indi-
cating it proved their point.
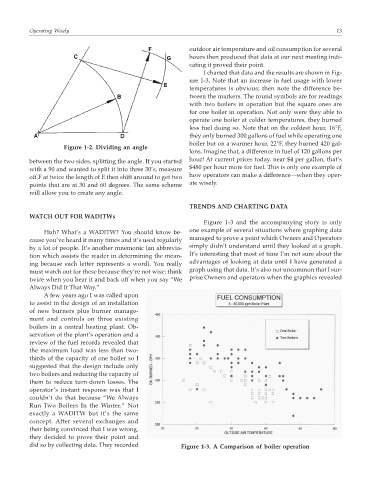
I charted that data and the results are shown in Fig-
ure 1-3. Note that an increase in fuel usage with lower
temperatures is obvious; then note the difference be-
tween the markers. The round symbols are for readings
with two boilers in operation but the square ones are
for one boiler in operation. Not only were they able to
operate one boiler at colder temperatures, they burned
less fuel doing so. Note that on the coldest hour, 16°F,
they only burned 300 gallons of fuel while operating one
boiler but on a warmer hour, 22°F, they burned 420 gal-
Figure 1-2. Dividing an angle
lons. Imagine that, a difference in fuel of 120 gallons per
hour! At current prices today, near $4 per gallon, that’s
between the two sides, splitting the angle. If you started
$480 per hour more for fuel. This is only one example of
with a 90 and wanted to split it into three 30’s, measure
how operators can make a difference—when they oper-
off F at twice the length of E then shift around to get two
ate wisely.
points that are at 30 and 60 degrees. The same scheme
will allow you to create any angle.
TRENDS AND CHARTING DATA
WATCH OUT FOR WADITWs
Figure 1-3 and the accompanying story is only
one example of several situations where graphing data
Huh? What’s a WADITW? You should know be-
managed to prove a point which Owners and Operators
cause you’ve heard it many times and it’s used regularly
simply didn’t understand until they looked at a graph.
by a lot of people. It’s another mnemonic (an abbrevia-
It’s interesting that most of time I’m not sure about the
tion which assists the reader in determining the mean-
advantages of looking at data until I have generated a
ing because each letter represents a word). You really
graph using that data. It’s also not uncommon that I sur-
must watch out for these because they’re not wise; think
prise Owners and operators when the graphics revealed
twice when you hear it and back off when you say “We
Always Did It That Way.”
A few years ago I was called upon
to assist in the design of an installation
of new burners plus burner manage-
ment and controls on three existing
boilers in a central heating plant. Ob-
servation of the plant’s operation and a
review of the fuel records revealed that
the maximum load was less than two-
thirds of the capacity of one boiler so I
suggested that the design include only
two boilers and reducing the capacity of
them to reduce turn-down losses. The
operator’s instant response was that I
couldn’t do that because “We Always
Run Two Boilers In the Winter.” Not
exactly a WADITW but it’s the same
concept. After several exchanges and
their being convinced that I was wrong,
they decided to prove their point and
did so by collecting data. They recorded Figure 1-3. A Comparison of boiler operation