
Page 37 - Boiler plant and distribution system optimization manual
P. 37
22 Boiler Plant and Distribution System Optimization Manual
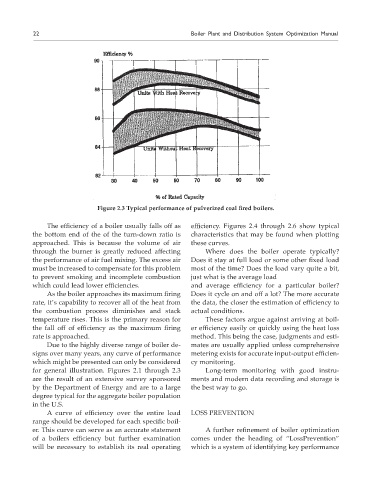
Figure 2.3 Typical performance of pulverized coal fired boilers.
The efficiency of a boiler usually falls off as efficiency. Figures 2.4 through 2.6 show typical
the bottom end of the of the turn-down ratio is characteristics that may be found when plotting
approached. This is because the volume of air these curves.
through the burner is greatly reduced affecting Where does the boiler operate typically?
the performance of air fuel mixing. The excess air Does it stay at full load or some other fixed load
must be increased to compensate for this problem most of the time? Does the load vary quite a bit,
to prevent smoking and incomplete combustion just what is the average load
which could lead lower efficiencies. and average efficiency for a particular boiler?
As the boiler approaches its maximum firing Does it cycle on and off a lot? The more accurate
rate, it’s capability to recover all of the heat from the data, the closer the estimation of efficiency to
the combustion process diminishes and stack actual conditions.
temperature rises. This is the primary reason for These factors argue against arriving at boil-
the fall off of efficiency as the maximum firing er efficiency easily or quickly using the heat loss
rate is approached. method. This being the case, judgments and esti-
Due to the highly diverse range of boiler de- mates are usually applied unless comprehensive
signs over many years, any curve of performance metering exists for accurate input-output efficien-
which might be presented can only be considered cy monitoring.
for general illustration. Figures 2.1 through 2.3 Long-term monitoring with good instru-
are the result of an extensive survey sponsored ments and modern data recording and storage is
by the Department of Energy and are to a large the best way to go.
degree typical for the aggregate boiler population
in the U.S.
A curve of efficiency over the entire load LOSS PREVENTION
range should be developed for each specific boil-
er. This curve can serve as an accurate statement A further refinement of boiler optimization
of a boilers efficiency but further examination comes under the heading of “Loss Prevention”
will be necessary to establish its real operating which is a system of identifying key performance