Page 47 - Boiler plant and distribution system optimization manual
P. 47

32                                                  Boiler Plant and Distribution System Optimization Manual


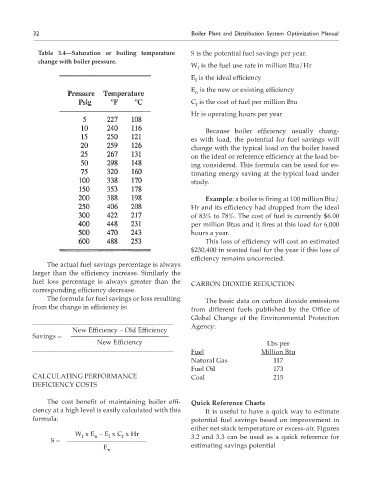
                  Table 3.4—Saturation or boiling temperature       S is the potential fuel savings per year.
                  change with boiler pressure.
                                                                    W  is the fuel use rate in million Btu/Hr
                                                                      f
                                                                    E  is the ideal efficiency
                                                                     I
                                                                    E  is the new or existing efficiency
                                                                     n
                                                                    C  is the cost of fuel per million Btu
                                                                      f
                                                                    Hr is operating hours per year

                                                                         Because boiler  efficiency  usually  chang-
                                                                    es  with  load,  the  potential  for  fuel  savings  will
                                                                    change with the typical load on the boiler based
                                                                    on the ideal or reference efficiency at the load be-
                                                                    ing considered. This formula can be used for es-
                                                                    timating energy saving at the typical load under
                                                                    study.

                                                                         Example: a boiler is firing at 100 million Btu/
                                                                    Hr and its efficiency had dropped from the ideal
                                                                    of 83% to 78%. The cost of fuel is currently $6.00
                                                                    per million Btus and it fires at this load for 6,000
                                                                    hours a year.
                                                                         This loss of efficiency will cost an estimated
                                                                    $230,400 in wasted fuel for the year if this loss of
                                                                    efficiency remains uncorrected.
                     The actual fuel savings percentage is always
                larger than the  efficiency  increase.  Similarly  the
                fuel  loss  percentage  is  always  greater  than  the   CARBON DIOxIDE REDUCTION
                corresponding efficiency decrease.
                     The formula for fuel savings or loss resulting      The basic data on carbon dioxide emissions
                from the change in efficiency is:                   from  different  fuels  published  by  the  Office  of

                                                                    Global Change of the Environmental Protection
                ———————————————————————                             Agency:
                             New Efficiency – Old Efficiency
                Savings =   ————————————————
                                     New Efficiency                                          Lbs per
                ———————————————————————                             Fuel                   Million Btu
                                                                    Natural Gas                117
                                                                    Fuel Oil                   173
                CALCULATING PERFORMANCE                             Coal                       215
                DEFICIENCY COSTS


                     The  cost  benefit  of  maintaining  boiler  effi-  Quick Reference Charts
                ciency at a high level is easily calculated with this      It is useful to have a quick way to estimate
                formula:                                            potential fuel savings based on improvement in
                                                                    either net stack temperature or excess-air. Figures
                              W  f  x E  – E  x C  x Hr             3.2 and 3.3 can be used as a quick reference for
                                         I
                                             f
                                    n
                      S =  —————————————
                                       E n                          estimating savings potential
   42   43   44   45   46   47   48   49   50   51   52