
Page 47 - Build Your Own Quadcopter_ Power Up Your Designs with the Parallax Elev-8
P. 47
26 Bu il d Y o ur O w n Q u a d c o p t e r
to a step input applied to the control system. Time is usually the X axis, while the Y axis will
normally be the process variable units, such as the temperature degrees in our thermostat
example. The following definitions are commonly but not universally accepted in the control
industry:
• Rise time—The time to go from 5% to 95% after the step is applied.
• Percent overshoot—The peak value of the response expressed as a percentage of the
steady-state value.
• Settling time—Time to settle to within a certain percentage of steady state. Often
chosen at 5% but not guaranteed.
• Steady-state error—The actual output versus the ideal output.
Several other performance parameters are also used to help characterize control systems.
These are:
• Deadtime—A measure of the time delay between a process variable change and
system recognition of that change.
• Loop cycle—Time between calls to the control system algorithm.
Both of these parameters will have a significant impact on a quadcopter control system.
Minimizing dead time and loop-cycle timing is critical to optimizing the control algorithms.
Careful optimization of the source code and incorporation of the assembly language routines,
where necessary, will go a long way toward minimizing both of these parameters.
PID Theory
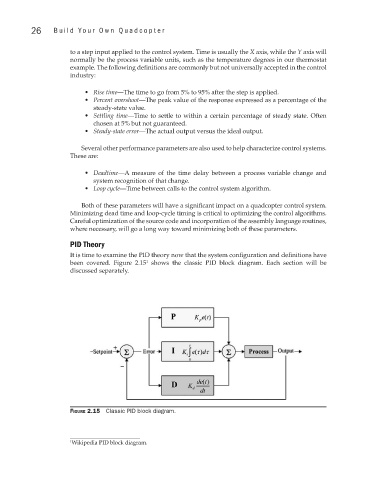
It is time to examine the PID theory now that the system configuration and definitions have
been covered. Figure 2.15 shows the classic PID block diagram. Each section will be
1
discussed separately.
Figure 2.15 Classic PID block diagram.
1 Wikipedia PID block diagram.