
Page 219 - Build Your Own Transistor Radios a Hobbyists Guide to High-Performance and Low-Powered Radio Circuits
P. 219
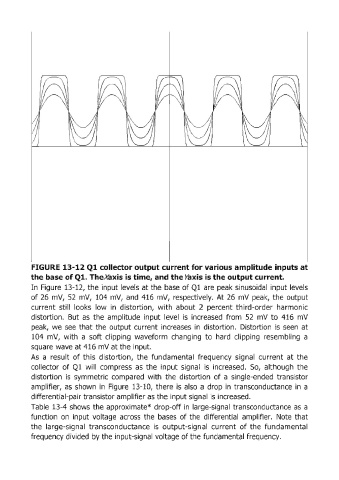
FIGURE 13-12 Q1 collector output current for various amplitude inputs at
            the base of Q1. The.-\axis is time, and the >axis is the output current.
            In  Figure  13-12, the input levels at the  base  of Q1  are  peak sinusoidal  input levels
            of 26  mV,  52  mV,  104  mV,  and  416  mV,  respectively.  At  26  mV  peak,  the output

            current  still  looks  low  in  distortion,  with  about  2  percent  third-order  harmonic
            distortion.  But  as  the  amplitude  input  level  is  increased  from  52  mV  to  416  mV
            peak,  we  see  that the  output current  increases  in  distortion.  Distortion  is  seen  at
            104  mV,  with  a soft  clipping  waveform  changing  to  hard  clipping  resembling  a
            square wave at 416 mV at the input.

            As  a  result  of this  distortion,  the  fundamental  frequency  signal  current  at  the
            collector  of Q1  will  compress  as  the  input  signal  is  increased.  So,  although  the
            distortion  is  symmetric  compared  with  the  distortion  of a  single-ended  transistor
            amplifier,  as  shown  in  Figure  13-10,  there  is  also  a drop  in  transconductance  in  a
            differential-pair transistor amplifier as the input signal  is increased.
            Table  13-4 shows  the approximate' drop-off in  large-signal transconductance  as  a

            function  on  input  voltage  across  the  bases  of the  differential  amplifier.  Note  that
            the  large-signal  transconductance  is  output-signal  current  of the  fundamental
            frequency divided  by the input-signal voltage of the fundamental frequency.