
Page 21 - Building A Succesful Board-Test Strategy
P. 21
8 BUILDING A SUCCESSFUL BOARD-TEST STRATEGY
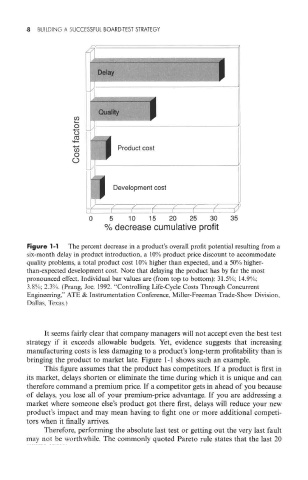
Figure 1-1 The percent decrease in a product's overall profit potential resulting from a
six-month delay in product introduction, a 10% product price discount to accommodate
quality problems, a total product cost 10% higher than expected, and a 50% higher-
than-expected development cost. Note that delaying the product has by far the most
pronounced effect. Individual bar values are (from top to bottom): 31.5%; 14.9%;
3.8%; 2.3%. (Prang, Joe. 1992. "Controlling Life-Cycle Costs Through Concurrent
Engineering," ATE & Instrumentation Conference, Miller-Freeman Trade-Show Division,
Dallas, Texas.)
It seems fairly clear that company managers will not accept even the best test
strategy if it exceeds allowable budgets. Yet, evidence suggests that increasing
manufacturing costs is less damaging to a product's long-term profitability than is
bringing the product to market late. Figure 1-1 shows such an example.
This figure assumes that the product has competitors. If a product is first in
its market, delays shorten or eliminate the time during which it is unique and can
therefore command a premium price. If a competitor gets in ahead of you because
of delays, you lose all of your premium-price advantage. If you are addressing a
market where someone else's product got there first, delays will reduce your new
product's impact and may mean having to fight one or more additional competi-
tors when it finally arrives.
Therefore, performing the absolute last test or getting out the very last fault
may not be worthwhile. The commonly quoted Pareto rule states that the last 20