
Page 36 - Building A Succesful Board-Test Strategy
P. 36
22 BUILDING A SUCCESSFUL BOARD-TEST STRATEGY
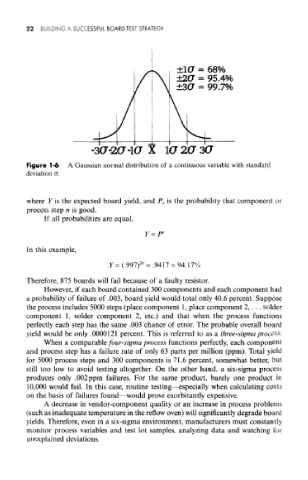
±1(7 = 68%
±2(7 = 95.4%
±3(7 = 99.7%
-3(7-20" -1(7 X 1(72(73(7
Figure 1-6 A Gaussian normal distribution of a continuous variable with standard
deviation o.
where Y is the expected board yield, and P n is the probability that component or
process step n is good.
If all probabilities are equal,
n
Y=P
In this example,
20
Y= (.997) = .9417 = 94.17%
Therefore, 875 boards will fail because of a faulty resistor.
However, if each board contained 300 components and each component had
a probability of failure of .003, board yield would total only 40.6 percent. Suppose
the process includes 5000 steps (place component 1, place component 2, . . . solder
component 1, solder component 2, etc.) and that when the process functions
perfectly each step has the same .003 chance of error. The probable overall board
yield would be only .0000121 percent. This is referred to as a three-sigma process.
When a comparable four-sigma process functions perfectly, each component
and process step has a failure rate of only 63 parts per million (ppm). Total yield
for 5000 process steps and 300 components is 71.6 percent, somewhat better, but
still too low to avoid testing altogether. On the other hand, a six-sigma process
produces only .002 ppm failures. For the same product, barely one product in
10,000 would fail. In this case, routine testing—especially when calculating costs
on the basis of failures found—would prove exorbitantly expensive.
A decrease in vendor-component quality or an increase in process problems
(such as inadequate temperature in the reflow oven) will significantly degrade board
yields. Therefore, even in a six-sigma environment, manufacturers must constantly
monitor process variables and test lot samples, analyzing data and watching for
unexplained deviations.