
Page 179 - Buried Pipe Design
P. 179
Design of Gravity Flow Pipes 153
E i
log P a σ 3 n
E = K P
i
a P
a
σ 3
log P a
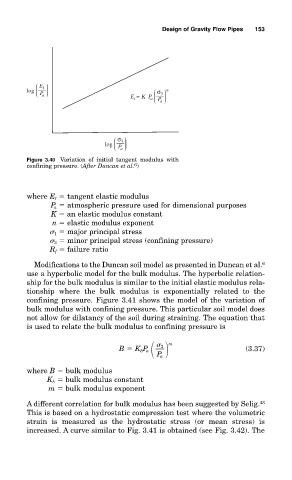
Figure 3.40 Variation of initial tangent modulus with
confining pressure. (After Duncan et al. 6 )
where E t tangent elastic modulus
P a atmospheric pressure used for dimensional purposes
K an elastic modulus constant
n elastic modulus exponent
1 major principal stress
3 minor principal stress (confining pressure)
R f failure ratio
Modifications to the Duncan soil model as presented in Duncan et al. 6
use a hyperbolic model for the bulk modulus. The hyperbolic relation-
ship for the bulk modulus is similar to the initial elastic modulus rela-
tionship where the bulk modulus is exponentially related to the
confining pressure. Figure 3.41 shows the model of the variation of
bulk modulus with confining pressure. This particular soil model does
not allow for dilatancy of the soil during straining. The equation that
is used to relate the bulk modulus to confining pressure is
m
3
B K b P a (3.37)
P a
where B bulk modulus
K b bulk modulus constant
m bulk modulus exponent
A different correlation for bulk modulus has been suggested by Selig. 43
This is based on a hydrostatic compression test where the volumetric
strain is measured as the hydrostatic stress (or mean stress) is
increased. A curve similar to Fig. 3.41 is obtained (see Fig. 3.42). The