
Page 292 - Caldera Volcanism Analysis, Modelling and Response
P. 292
A Review on Collapse Caldera Modelling 267
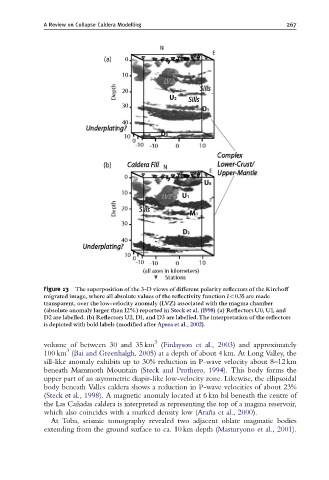
Figure 13 The superposition of the 3-D views of di¡erent polarity re£ectors of the Kircho¡
migrated image, where all absolute values of the re£ectivity function Io0.35 are made
transparent, over the low-velocity anomaly (LVZ) associated with the magma chamber
(absolute anomaly larger than 12%) reported in Steck et al. (1998) (a) Re£ectors U0, U1, and
D2 are labelled. (b) Re£ectors U2, D1, and D3 are labelled.The interpretation of the re£ectors
is depicted with bold labels (modi¢ed after Aprea et al., 2002).
3
volume of between 30 and 35 km (Finlayson et al., 2003) and approximately
3
100 km (Bai and Greenhalgh, 2005) at a depth of about 4 km. At Long Valley, the
sill-like anomaly exhibits up to 30% reduction in P-wave velocity about 8–12 km
beneath Mammoth Mountain (Steck and Prothero, 1994). This body forms the
upper part of an asymmetric diapir-like low-velocity zone. Likewise, the ellipsoidal
body beneath Valles caldera shows a reduction in P-wave velocities of about 23%
(Steck et al., 1998). A magnetic anomaly located at 6 km bsl beneath the centre of
the Las Can ˜adas caldera is interpreted as representing the top of a magma reservoir,
which also coincides with a marked density low (Aran ˜a et al., 2000).
At Toba, seismic tomography revealed two adjacent oblate magmatic bodies
extending from the ground surface to ca. 10 km depth (Masturyono et al., 2001).