
Page 405 - Caldera Volcanism Analysis, Modelling and Response
P. 405
380 Claudia Troise et al.
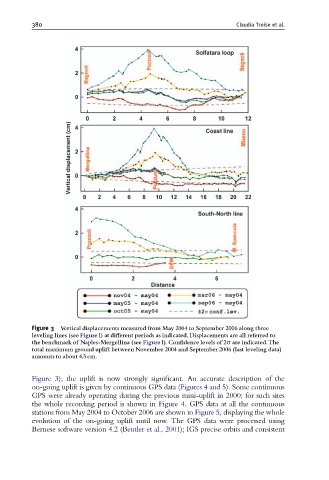
Figure 3 Vertical displacements measured from May 2004 to September 2006 along three
leveling lines (see Figure1) at di¡erent periods as indicated. Displacements are all referred to
the benchmark of Naples-Mergellina (see Figure1). Con¢dence levels of 2s are indicated.The
total maximum ground uplift between November 2004 and September 2006 (last leveling data)
amounts to about 4.5 cm.
Figure 3); the uplift is now strongly significant. An accurate description of the
on-going uplift is given by continuous GPS data (Figures 4 and 5). Some continuous
GPS were already operating during the previous mini-uplift in 2000; for such sites
the whole recording period is shown in Figure 4. GPS data at all the continuous
stations from May 2004 to October 2006 are shown in Figure 5, displaying the whole
evolution of the on-going uplift until now. The GPS data were processed using
Bernese software version 4.2 (Beutler et al., 2001); IGS precise orbits and consistent