
Page 406 - Caldera Volcanism Analysis, Modelling and Response
P. 406
A New Uplift Episode at Campi Flegrei Caldera (Southern Italy) 381
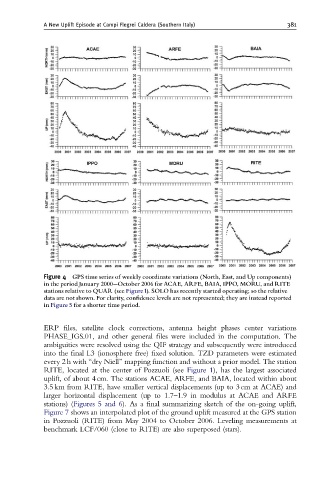
Figure 4 GPS time series of weekly coordinate variations (North, East, and Up components)
in the period January 2000--October 2006 for ACAE, ARFE, BAIA, IPPO, MORU, and RITE
stations relative to QUAR (see Figure1). SOLO has recently started operating; so the relative
data are not shown. For clarity, con¢dence levels are not represented; they are instead reported
in Figure 5 for a shorter time period.
ERP files, satellite clock corrections, antenna height phases center variations
PHASE_IGS.01, and other general files were included in the computation. The
ambiguities were resolved using the QIF strategy and subsequently were introduced
into the final L3 (ionosphere free) fixed solution. TZD parameters were estimated
every 2 h with ‘‘dry Niell’’ mapping function and without a prior model. The station
RITE, located at the center of Pozzuoli (see Figure 1), has the largest associated
uplift, of about 4 cm. The stations ACAE, ARFE, and BAIA, located within about
3.5 km from RITE, have smaller vertical displacements (up to 3 cm at ACAE) and
larger horizontal displacement (up to 1.7–1.9 in modulus at ACAE and ARFE
stations) (Figures 5 and 6). As a final summarizing sketch of the on-going uplift,
Figure 7 shows an interpolated plot of the ground uplift measured at the GPS station
in Pozzuoli (RITE) from May 2004 to October 2006. Leveling measurements at
benchmark LCF/060 (close to RITE) are also superposed (stars).