
Page 408 - Caldera Volcanism Analysis, Modelling and Response
P. 408
A New Uplift Episode at Campi Flegrei Caldera (Southern Italy) 383
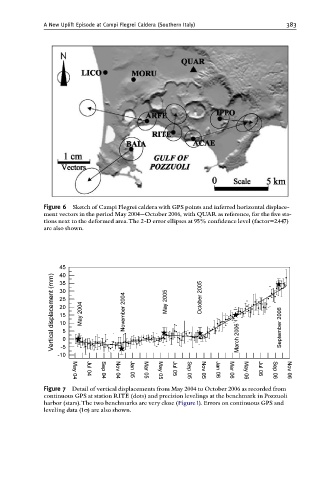
Figure 6 Sketch of Campi Flegrei caldera with GPS points and inferred horizontal displace-
ment vectors in the period May 2004--October 2006, with QUAR as reference, for the ¢ve sta-
tions next to the deformed area.The 2-D error ellipses at 95% con¢dence level (factor=2.447)
are also shown.
Figure 7 Detail of vertical displacements from May 2004 to October 2006 as recorded from
continuous GPS at station RITE (dots) and precision levelings at the benchmark in Pozzuoli
harbor (stars).The two benchmarks are very close (Figure1). Errors on continuous GPS and
leveling data (1s) are also shown.