
Page 431 - Caldera Volcanism Analysis, Modelling and Response
P. 431
406 Micol Todesco
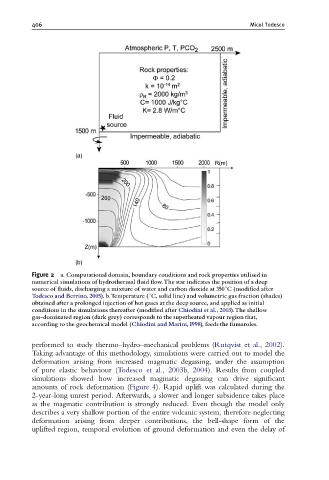
Figure 2 a. Computational domain, boundary conditions and rock properties utilised in
numerical simulations of hydrothermal £uid £ow.The star indicates the position of a deep
source of £uids, discharging a mixture of water and carbon dioxide at 3501C (modi¢ed after
Todesco and Berrino, 2005). b.Temperature (1C, solid line) and volumetric gas fraction (shades)
obtained after a prolonged injection of hot gases at the deep source, and applied as initial
conditions in the simulations thereafter (modi¢ed after Chiodini et al., 2003).The shallow
gas-dominated region (dark grey) corresponds to the superheated vapour region that,
according to the geochemical model (Chiodini and Marini,1998), feeds the fumaroles.
performed to study thermo–hydro–mechanical problems (Rutqvist et al., 2002).
Taking advantage of this methodology, simulations were carried out to model the
deformation arising from increased magmatic degassing, under the assumption
of pure elastic behaviour (Todesco et al., 2003b, 2004). Results from coupled
simulations showed how increased magmatic degassing can drive significant
amounts of rock deformation (Figure 4). Rapid uplift was calculated during the
2-year-long unrest period. Afterwards, a slower and longer subsidence takes place
as the magmatic contribution is strongly reduced. Even though the model only
describes a very shallow portion of the entire volcanic system, therefore neglecting
deformation arising from deeper contributions, the bell-shape form of the
uplifted region, temporal evolution of ground deformation and even the delay of