
Page 432 - Caldera Volcanism Analysis, Modelling and Response
P. 432
Hydrothermal Fluid Circulation and its Effect on Caldera Unrest 407
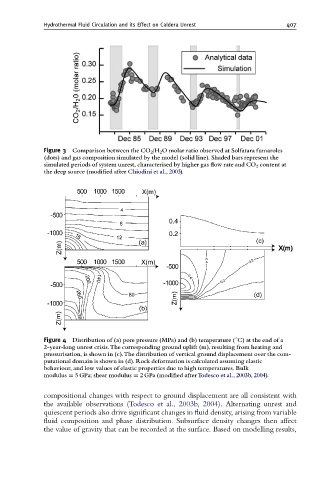
Figure 3 Comparison between the CO 2 /H 2 O molar ratio observed at Solfatara fumaroles
(dots) and gas composition simulated by the model (solid line). Shaded bars represent the
simulated periods of system unrest, characterised by higher gas £ow rate and CO 2 content at
the deep source (modi¢ed after Chiodini et al., 2003).
Figure 4 Distribution of (a) pore pressure (MPa) and (b) temperature (1C) at the end of a
2-year-long unrest crisis.The corresponding ground uplift (m), resulting from heating and
pressurisation, is shown in (c).The distribution of vertical ground displacement over the com-
putational domain is shown in (d). Rock deformation is calculated assuming elastic
behaviour, and low values of elastic properties due to high temperatures. Bulk
modulus ¼ 5 GPa; shear modulus ¼ 2 GPa (modi¢ed afterTodesco et al., 2003b, 2004).
compositional changes with respect to ground displacement are all consistent with
the available observations (Todesco et al., 2003b, 2004). Alternating unrest and
quiescent periods also drive significant changes in fluid density, arising from variable
fluid composition and phase distribution. Subsurface density changes then affect
the value of gravity that can be recorded at the surface. Based on modelling results,