
Page 433 - Caldera Volcanism Analysis, Modelling and Response
P. 433
408 Micol Todesco
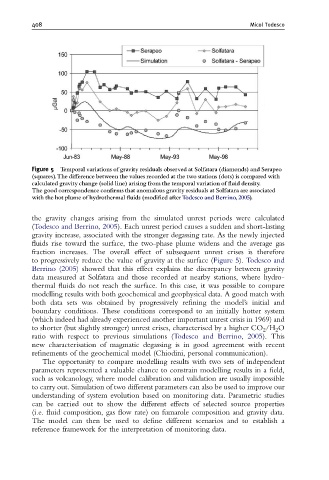
Figure 5 Temporal variations of gravity residuals observed at Solfatara (diamonds) and Serapeo
(squares).The di¡erence between the values recorded at the two stations (dots) is compared with
calculated gravity change (solid line) arising from the temporal variation of £uid density.
The good correspondence con¢rms that anomalous gravity residuals at Solfatara are associated
with the hot plume of hydrothermal £uids (modi¢ed afterTodesco and Berrino, 2005).
the gravity changes arising from the simulated unrest periods were calculated
(Todesco and Berrino, 2005). Each unrest period causes a sudden and short-lasting
gravity increase, associated with the stronger degassing rate. As the newly injected
fluids rise toward the surface, the two-phase plume widens and the average gas
fraction increases. The overall effect of subsequent unrest crises is therefore
to progressively reduce the value of gravity at the surface (Figure 5). Todesco and
Berrino (2005) showed that this effect explains the discrepancy between gravity
data measured at Solfatara and those recorded at nearby stations, where hydro-
thermal fluids do not reach the surface. In this case, it was possible to compare
modelling results with both geochemical and geophysical data. A good match with
both data sets was obtained by progressively refining the model’s initial and
boundary conditions. These conditions correspond to an initially hotter system
(which indeed had already experienced another important unrest crisis in 1969) and
to shorter (but slightly stronger) unrest crises, characterised by a higher CO 2 /H 2 O
ratio with respect to previous simulations (Todesco and Berrino, 2005). This
new characterisation of magmatic degassing is in good agreement with recent
refinements of the geochemical model (Chiodini, personal communication).
The opportunity to compare modelling results with two sets of independent
parameters represented a valuable chance to constrain modelling results in a field,
such as volcanology, where model calibration and validation are usually impossible
to carry out. Simulation of two different parameters can also be used to improve our
understanding of system evolution based on monitoring data. Parametric studies
can be carried out to show the different effects of selected source properties
(i.e. fluid composition, gas flow rate) on fumarole composition and gravity data.
The model can then be used to define different scenarios and to establish a
reference framework for the interpretation of monitoring data.