
Page 65 - Caldera Volcanism Analysis, Modelling and Response
P. 65
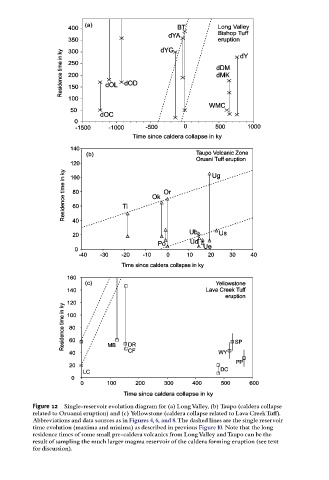
Figure 12  Single-reservoir evolution diagram for (a) LongValley, (b) Taupo (caldera collapse
          related to Oruanui eruption) and (c) Yellowstone (caldera collapse related to Lava CreekTu¡).
          Abbreviations and data sources as in Figures 4, 6, and 8.The dashed lines are the single reservoir
          time evolution (maxima and minima) as described in previous Figure10. Note that the long
          residence times of some small pre-caldera volcanics from LongValley andTaupo can be the
          result of sampling the much larger magma reservoir of the caldera forming eruption (see text
          for discussion).