
Page 69 - Caldera Volcanism Analysis, Modelling and Response
P. 69
44 Fidel Costa
should be tested by transport and thermal models for silicic magma generation
(e.g., Petford et al., 2000; Annen and Sparks, 2002; Dufek and Bergantz, 2005;
Michaut and Jaupart, 2006).
The interpretation of the low magma production rates for small eruptions
involves other factors related to the significance of the residence times. The
evidence for crystal recycling discussed above for some post-caldera deposits can
explain their artificially low magma production rates. However, if the low magma
production rates estimated for other small pre- and post-caldera magmas are correct,
they could be interpreted as ‘the rise and the fall’ of a large caldera-related
magmatic episode where magma input rates change with time.
4.3.1. Magma cooling rates
5
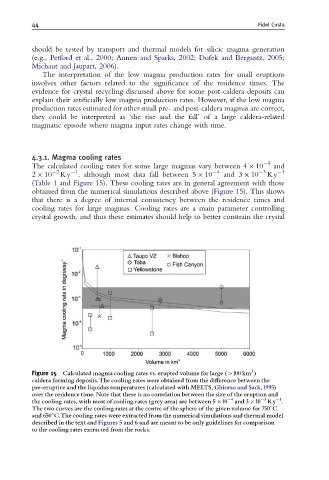
The calculated cooling rates for some large magmas vary between 4 10 and
2 1 4 3 1
2 10 Ky , although most data fall between 5 10 and 3 10 Ky
(Table 1 and Figure 15). These cooling rates are in general agreement with those
obtained from the numerical simulations described above (Figure 15). This shows
that there is a degree of internal consistency between the residence times and
cooling rates for large magmas. Cooling rates are a main parameter controlling
crystal growth, and thus these estimates should help to better constrain the crystal
3
Figure 15 Calculated magma cooling rates vs. erupted volume for large (W100 km )
caldera forming deposits.The cooling rates were obtained from the di¡erence between the
pre-eruptive and the liquidus temperatures (calculated with MELTS, Ghiorso and Sack,1995)
over the residence time. Note that there is no correlation between the size of the eruption and
1
the cooling rates, with most of cooling rates (grey area) are between 5 10 4 and 3 10 3 Ky .
The two curves are the cooling rates at the centre of the sphere of the given volume for 7501C
and 6501C.The cooling rates were extracted from the numerical simulations and thermal model
described in the text and Figures 5 and 6 and are meant to be only guidelines for comparison
to the cooling rates extracted from the rocks.