
Page 67 - Caldera Volcanism Analysis, Modelling and Response
P. 67
42 Fidel Costa
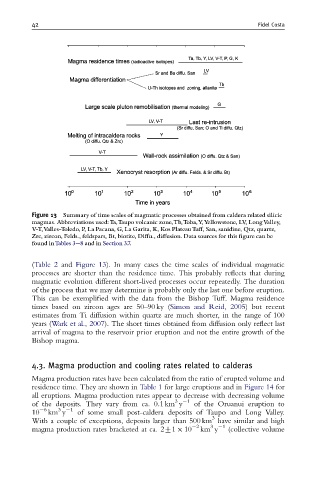
Figure 13 Summary of time scales of magmatic processes obtained from caldera related silicic
magmas. Abbreviations used:Ta,Taupo volcanic zone,Tb,Toba,Y,Yellowstone, LV, LongValley,
V-T,Valles-Toledo, P, La Pacana, G, La Garita, K, Kos PlateauTu¡, San, sanidine, Qtz, quartz,
Zrc, zircon, Felds., feldspars, Bt, biotite, Di¡u., di¡usion. Data sources for this ¢gure can be
found inTables 3--8 and in Section 3.7.
(Table 2 and Figure 13). In many cases the time scales of individual magmatic
processes are shorter than the residence time. This probably reflects that during
magmatic evolution different short-lived processes occur repeatedly. The duration
of the process that we may determine is probably only the last one before eruption.
This can be exemplified with the data from the Bishop Tuff. Magma residence
times based on zircon ages are 50–90 ky (Simon and Reid, 2005) but recent
estimates from Ti diffusion within quartz are much shorter, in the range of 100
years (Wark et al., 2007). The short times obtained from diffusion only reflect last
arrival of magma to the reservoir prior eruption and not the entire growth of the
Bishop magma.
4.3. Magma production and cooling rates related to calderas
Magma production rates have been calculated from the ratio of erupted volume and
residence time. They are shown in Table 1 for large eruptions and in Figure 14 for
all eruptions. Magma production rates appear to decrease with decreasing volume
3 1
of the deposits. They vary from ca. 0.1 km y of the Oruanui eruption to
6 3 1
10 km y of some small post-caldera deposits of Taupo and Long Valley.
3
With a couple of exceptions, deposits larger than 500 km have similar and high
3 1
magma production rates bracketed at ca. 271 10 2 km y (collective volume