
Page 157 - Carbon Nanotube Fibres and Yarns
P. 157
Carbon nanotube yarn structures and properties 149
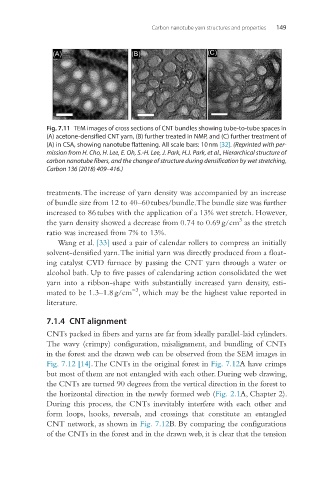
Fig. 7.11 TEM images of cross sections of CNT bundles showing tube-to-tube spaces in
(A) acetone-densified CNT yarn, (B) further treated in NMP, and (C) further treatment of
(A) in CSA, showing nanotube flattening. All scale bars: 10 nm [32]. (Reprinted with per-
mission from H. Cho, H. Lee, E. Oh, S.-H. Lee, J. Park, H.J. Park, et al., Hierarchical structure of
carbon nanotube fibers, and the change of structure during densification by wet stretching,
Carbon 136 (2018) 409–416.)
treatments. The increase of yarn density was accompanied by an increase
of bundle size from 12 to 40–60 tubes/bundle. The bundle size was further
increased to 86 tubes with the application of a 13% wet stretch. However,
3
the yarn density showed a decrease from 0.74 to 0.69 g/cm as the stretch
ratio was increased from 7% to 13%.
Wang et al. [33] used a pair of calendar rollers to compress an initially
solvent-densified yarn. The initial yarn was directly produced from a float-
ing catalyst CVD furnace by passing the CNT yarn through a water or
alcohol bath. Up to five passes of calendaring action consolidated the wet
yarn into a ribbon-shape with substantially increased yarn density, esti-
−3
mated to be 1.3–1.8 g/cm , which may be the highest value reported in
literature.
7.1.4 CNT alignment
CNTs packed in fibers and yarns are far from ideally parallel-laid cylinders.
The wavy (crimpy) configuration, misalignment, and bundling of CNTs
in the forest and the drawn web can be observed from the SEM images in
Fig. 7.12 [14]. The CNTs in the original forest in Fig. 7.12A have crimps
but most of them are not entangled with each other. During web drawing,
the CNTs are turned 90 degrees from the vertical direction in the forest to
the horizontal direction in the newly formed web (Fig. 2.1A, Chapter 2).
During this process, the CNTs inevitably interfere with each other and
form loops, hooks, reversals, and crossings that constitute an entangled
CNT network, as shown in Fig. 7.12B. By comparing the configurations
of the CNTs in the forest and in the drawn web, it is clear that the tension