
Page 151 - Carbon Nanotubes
P. 151
Vibrational modes of carbon nanotubes 141
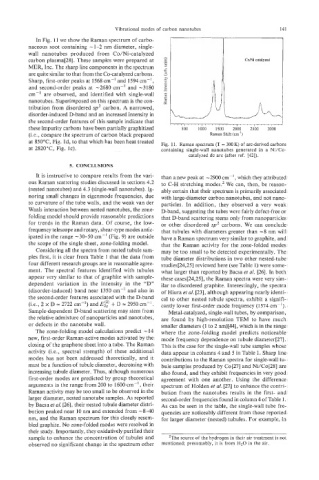
In Fig. 11 we show the Raman spectrum of carbo-
naceous soot containing - 1-2 nm diameter, single-
wall nanotubes produced from Co/Ni-catalyzed
carbon plasma[28]. These samples were prepared at
MER, Inc. The sharp line components in the spectrum
are quite similar to that from the Co-catalyzed carbons.
Sharp, first-order peaks at 1568 cm-' and 1594 cm-' ,
and second-order peaks at -2680 cm-' and -3180
cm.-' are observed, and identified with single-wall
nanotubes. Superimposed on this spectrum is the con-
tribution from disordered sp2 carbon. A narrowed,
disorder-induced D-band and an increased intensity in
the second-order features of this sample indicate that
I""1""""'I
these impurity carbons have been partially graphitized 500 1000 1500 2000 r"'I~"'1"
3000
2500
(Le., compare the spectrum of carbon black prepared Raman Shift (cm ')
at 850°C, Fig. ld, to that which has been heat treated Fig. 11. Raman spectrum (T = 300 K) of arc-derived carbons
at 2820°C, Fig. IC). containing single-wall nanotubes generated in a Ni/Co-
catalyzed dc arc (after ref. [42]).
5. CONCLUSIONS
It is instructive to compare results from the vari- than a new peak at -2900 cm-' , which they attributed
ous Raman scattering studies discussed in sections 4.2 to C-H stretching modes.2 We can, then, be reason-
(nested nanotubes) and 4.3 (single-wall nanotubes). Ig- ably certain that their spectrum is primarily associated
noring small changes in eigenmode frequencies, due with large-diameter carbon nanotubes, and not nano-
to curvature of the tube walls, and the weak van der particles. In addition, they observed a very weak
Waals interaction between nested nanotubes, the zone- D-band, suggesting the tubes were fairly defect-free or
folding model should provide reasonable predictions that D-band scattering stems only from nanoparticles
for trends in the Raman data. Of course, the low- or other disordered sp2 carbons. We can conclude
frequency telescope and rotary, shear-type modes antic- that tubules with diameters greater than -8 nm will
ipated in the range -30-50 cm-' (Fig. 9) are outside have a Raman spectrum very similar to graphite, and
the scope of the single sheet, zone-folding model. that the Raman activity for the zone-folded modes
Considering all the spectra from nested tubule sam- may be too small to be detected experimentally. The
ples first, it is clear from Table 1 that the data from tube diameter distributions in two other nested-tube
four different research groups are in reasonable agree- studies[24,25] reviewed here (see Table 1) were some-
ment. The spectral features identified with tubules what larger than reported by Bacsa et al. [26]. In both
appear very similar to that of graphite with sample- these cases[24,25], the Raman spectra were very sim-
dependent variation in the intensity in the "D" ilar to disordered graphite. Interestingly, the spectra
(disorder-induced) band near 1350 cm-' and also in of Hiura et a!. [23], although appearing nearly identi-
the second-order features associated with the D-band cal to other nested tubule spectra, exhibit a signifi-
(i.e., 2 x D = 2722 cm-') and E;:) + D = 2950 cm-'. cantly lower first-order mode frequency (1574 cm-').
Sample-dependent D-band scattering may stem from Metal-catalyzed, single-wall tubes, by comparison,
the relative admixture of nanoparticles and nanotubes, are found by high-resolution TEM to have much
or defects in the nanotube wall. smaller diameters (1 to 2 nm)[44], which is in the range
The zone-folding model calculations predict - 14 where the zone-folding model predicts noticeable
new, first-order Raman-active modes activated by the mode frequency dependence on tubuIe diameter[27].
closing of the graphene sheet into a tube. The Raman This is the case for the single-wall tube samples whose
activity (i.e., spectral strength) of these additional data appear in columns 4 and 5 in Table I. Sharp line
modes has not been addressed theoretically, and it contributions to the Raman spectra for single-wall tu-
must be a function of tubule diameter, decreasing with bule samples produced by Co[27] and Ni/Co[28] are
increasing tubule diameter. Thus, although numerous also found, and they exhibit frequencies in very good
first-order modes are predicted by group theoretical agreement with one another. Using the difference
arguments in the range from 200 to 1600 cm-', their spectrum of Holden et al. [27] to enhance the contri-
Raman activity may be too small to be observed in the bution from the nanotubes results in the first- and
larger diameter, nested nanotube samples. As reported second-order frequencies found in column 4 of Table 1.
by Bacsa et al. 1261, their nested tubule diameter distri- As can be seen in the table, the single-wall tube fre-
bution peaked near 10 nm and extended from -8-40 quencies are noticeably different from those reported
nm, and the Raman spectrum for this closely resem- for larger diameter (nested) tubules. For example, in
bled graphite. No zone-folded modes were resolved in
their study. Importantly, they oxidatively purified their
sample to enhance the concentration of tubules and 2The source of the hydrogen in their air treatment is not
observed no significant change in the spectrum other mentioned; presumably, it is from H,O in the air.