
Page 115 - Carrahers_Polymer_Chemistry,_Eighth_Edition
P. 115
78 Carraher’s Polymer Chemistry
Myoglobin
450
360
Response (mV) 270
180
RI
90
LS
DP
0
10.0 13.0 16.0 19.0 22.0 25.0
Retention volume (mL)
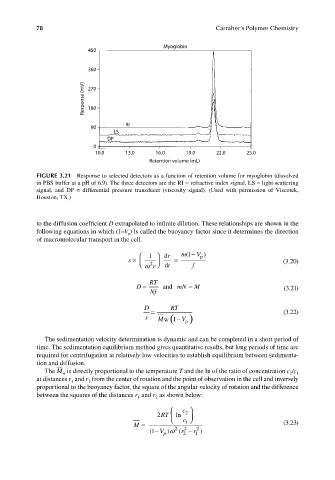
FIGURE 3.21 Response to selected detectors as a function of retention volume for myoglobin (dissolved
in PBS buffer at a pH of 6.9). The three detectors are the RI = refractive index signal, LS = light-scattering
signal, and DP = differential pressure transducer (viscosity signal). (Used with permission of Viscotek,
Houston, TX.)
to the diffusion coeffi cient D extrapolated to infinite dilution. These relationships are shown in the
following equations in which (1–V ) is called the buoyancy factor since it determines the direction
p
of macromolecular transport in the cell.
−
1 dr m (1 V p )
s = 2 = (3.20)
ω r dt f
D = RT and mN = M (3.21)
Nf
D RT
= (3.22)
s M W ( 1 V− )
p
The sedimentation velocity determination is dynamic and can be completed in a short period of
time. The sedimentation equilibrium method gives quantitative results, but long periods of time are
required for centrifugation at relatively low velocities to establish equilibrium between sedimenta-
tion and diffusion.
The M is directly proportional to the temperature T and the In of the ratio of concentration c /c
2
1
w
at distances r and r from the center of rotation and the point of observation in the cell and inversely
2
1
proportional to the buoyancy factor, the square of the angular velocity of rotation and the difference
between the squares of the distances r and r as shown below:
2
1
c
2
2RT ln c
M = 1 (3.23)
2
−
(1 V )ω 2 (r − r 2 )
p 2 1
K10478.indb 78 9/14/2010 3:37:01 PM
9/14/2010 3:37:01 PM
K10478.indb 78