
Page 111 - Carrahers_Polymer_Chemistry,_Eighth_Edition
P. 111
74 Carraher’s Polymer Chemistry
Detectors
Laser light source Sample
Scattered light
FIGURE 3.16 Multiple-detector arrangement showing a sample surrounded by an array of detectors.
+
+
+ +
+ +
+ + +
+ +
+ +
+ + + +
Hc /t + + + +
+ + +
+ +
1/M w +
+ Zero concentration
+
+ extrapolation curve
Zero angle
extrapolation curve
sin (u/2) − xc
2
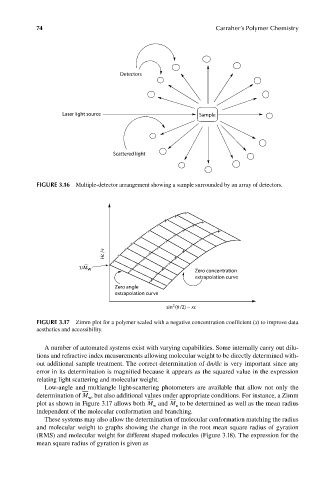
FIGURE 3.17 Zimm plot for a polymer scaled with a negative concentration coeffi cient (x) to improve data
aesthetics and accessibility.
A number of automated systems exist with varying capabilities. Some internally carry out dilu-
tions and refractive index measurements allowing molecular weight to be directly determined with-
out additional sample treatment. The correct determination of dn/dc is very important since any
error in its determination is magnified because it appears as the squared value in the expression
relating light scattering and molecular weight.
Low-angle and multiangle light-scattering photometers are available that allow not only the
determination of M , but also additional values under appropriate conditions. For instance, a Zimm
w
plot as shown in Figure 3.17 allows both M and M to be determined as well as the mean radius
n
w
independent of the molecular conformation and branching.
These systems may also allow the determination of molecular conformation matching the radius
and molecular weight to graphs showing the change in the root mean square radius of gyration
(RMS) and molecular weight for different shaped molecules (Figure 3.18). The expression for the
mean square radius of gyration is given as
9/14/2010 3:36:50 PM
K10478.indb 74 9/14/2010 3:36:50 PM
K10478.indb 74