
Page 107 - Carrahers_Polymer_Chemistry,_Eighth_Edition
P. 107
70 Carraher’s Polymer Chemistry
freely pass, but though which the large polymer molecules are unable to pass. Existing membranes
only approximate ideal semipermeability, the chief limitation being the passage of low molecular
weight chains through the membrane.
There is a thermodynamic drive toward dilution of the polymer-containing solution with a net
flow of solvent toward the cell containing the polymer. This results in an increase in liquid in that
cell causing a rise in the liquid level in the corresponding measuring tube. This rise in liquid level
is opposed and balanced by a hydrostatic pressure resulting in a difference in the liquid levels of
the two measuring tubes. The difference is directly related to the osmotic pressure of the polymer-
containing solution. Thus, solvent molecules pass through the semipermeable membrane reaching
a “static” equilibrium.
Since osmotic pressure is dependent on the number of particles present, the measurement of
this osmotic pressure can be used to determine the M of the dissolved polymer. The difference
n
in height (∆h) of the liquids in the columns is converted to osmotic pressure (π) by multiplying
the gravity (g) and the density of the solution (ρ), that is, π = ∆hρg. In the old static osmometers,
it might take weeks to months for equilibrium to become established allowing excessive passage
of polymer chains through the membrane. Today, automated osmometers allow molecular-weigh
measurements to occur in minutes with a minimal of passage of polymer chains through the mem-
brane. The relationship between molecular weight and osmotic pressure is given in the following
van’t Hoff equation:
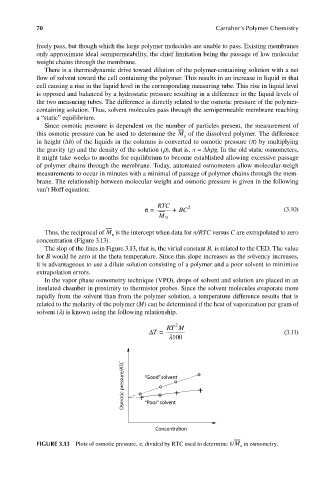
π = RTC + BC 2 (3.10)
M n
Thus, the reciprocal of M is the intercept when data for π/RTC versus C are extrapolated to zero
n
concentration (Figure 3.13).
The slop of the lines in Figure 3.13, that is, the virial constant B, is related to the CED. The value
for B would be zero at the theta temperature. Since this slope increases as the solvency increases,
it is advantageous to use a dilute solution consisting of a polymer and a poor solvent to minimize
extrapolation errors.
In the vapor phase osmometry technique (VPO), drops of solvent and solution are placed in an
insulated chamber in proximity to thermistor probes. Since the solvent molecules evaporate more
rapidly from the solvent than from the polymer solution, a temperature difference results that is
related to the molarity of the polymer (M) can be determined if the heat of vaporization per gram of
solvent (λ) is known using the following relationship.
2
∆ T = RT M (3.11)
λ 100
Osmotic pressure/RTC o + “Good” solvent o +
o
o
+
+
“Poor” solvent
Concentration
FIGURE 3.13 Plots of osmotic pressure, π, divided by RTC used to determine 1/M in osmometry.
n
9/14/2010 3:36:39 PM
K10478.indb 70
K10478.indb 70 9/14/2010 3:36:39 PM