
Page 105 - Carrahers_Polymer_Chemistry,_Eighth_Edition
P. 105
68 Carraher’s Polymer Chemistry
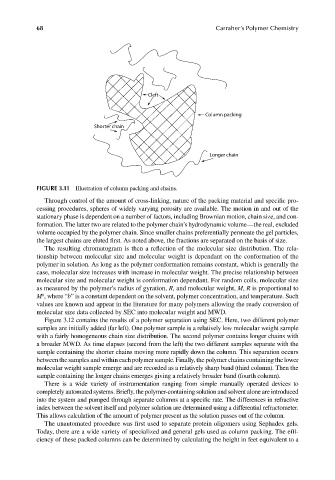
Cleft
Column packing
Shorter chain
Longer chain
FIGURE 3.11 Illustration of column packing and chains.
Through control of the amount of cross-linking, nature of the packing material and specifi c pro-
cessing procedures, spheres of widely varying porosity are available. The motion in and out of the
stationary phase is dependent on a number of factors, including Brownian motion, chain size, and con-
formation. The latter two are related to the polymer chain’s hydrodynamic volume—the real, excluded
volume occupied by the polymer chain. Since smaller chains preferentially permeate the gel particles,
the largest chains are eluted first. As noted above, the fractions are separated on the basis of size.
The resulting chromatogram is then a reflection of the molecular size distribution. The rela-
tionship between molecular size and molecular weight is dependant on the conformation of the
polymer in solution. As long as the polymer conformation remains constant, which is generally the
case, molecular size increases with increase in molecular weight. The precise relationship between
molecular size and molecular weight is conformation dependant. For random coils, molecular size
as measured by the polymer’s radius of gyration, R, and molecular weight, M, R is proportional to
b
M , where “b” is a constant dependent on the solvent, polymer concentration, and temperature. Such
values are known and appear in the literature for many polymers allowing the ready conversion of
molecular size data collected by SEC into molecular weight and MWD.
Figure 3.12 contains the results of a polymer separation using SEC. Here, two different polymer
samples are initially added (far left). One polymer sample is a relatively low molecular weight sample
with a fairly homogeneous chain size distribution. The second polymer contains longer chains with
a broader MWD. As time elapses (second from the left) the two different samples separate with the
sample containing the shorter chains moving more rapidly down the column. This separation occurs
between the samples and within each polymer sample. Finally, the polymer chains containing the lower
molecular weight sample emerge and are recorded as a relatively sharp band (third column). Then the
sample containing the longer chains emerges giving a relatively broader band (fourth column).
There is a wide variety of instrumentation ranging from simple manually operated devices to
completely automated systems. Briefly, the polymer-containing solution and solvent alone are introduced
into the system and pumped through separate columns at a specific rate. The differences in refractive
index between the solvent itself and polymer solution are determined using a differential refractometer.
This allows calculation of the amount of polymer present as the solution passes out of the column.
The unautomated procedure was first used to separate protein oligomers using Sephadex gels.
Today, there are a wide variety of specialized and general gels used as column packing. The effi -
ciency of these packed columns can be determined by calculating the height in feet equivalent to a
9/14/2010 3:36:38 PM
K10478.indb 68 9/14/2010 3:36:38 PM
K10478.indb 68