
Page 100 - Carrahers_Polymer_Chemistry,_Eighth_Edition
P. 100
Molecular Weight of Polymers 63
FIGURE 3.7 Jar with capsules, each containing a single polymer chain where the capsule size is directly
related to the size of the polymer chain within the capsule.
N i
M i
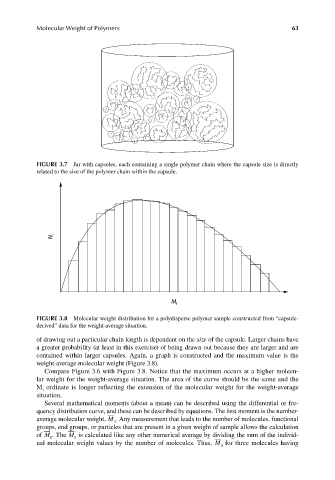
FIGURE 3.8 Molecular weight distribution for a polydisperse polymer sample constructed from “capsule-
derived” data for the weight-average situation.
of drawing out a particular chain length is dependent on the size of the capsule. Larger chains have
a greater probability (at least in this exercise) of being drawn out because they are larger and are
contained within larger capsules. Again, a graph is constructed and the maximum value is the
weight-average molecular weight (Figure 3.8).
Compare Figure 3.6 with Figure 3.8. Notice that the maximum occurs at a higher molecu-
lar weight for the weight-average situation. The area of the curve should be the same and the
M ordinate is longer reflecting the extension of the molecular weight for the weight-average
i
situation.
Several mathematical moments (about a mean) can be described using the differential or fre-
quency distribution curve, and these can be described by equations. The first moment is the number-
average molecular weight, M . Any measurement that leads to the number of molecules, functional
n
groups, end groups, or particles that are present in a given weight of sample allows the calculation
of M . The M is calculated like any other numerical average by dividing the sum of the individ-
n n
ual molecular weight values by the number of molecules. Thus, M for three molecules having
n
9/14/2010 3:36:20 PM
K10478.indb 63 9/14/2010 3:36:20 PM
K10478.indb 63