
Page 302 - Challenges in Corrosion Costs Causes Consequences and Control(2015)
P. 302
280 CORROSION CONTROL AND PREVENTION
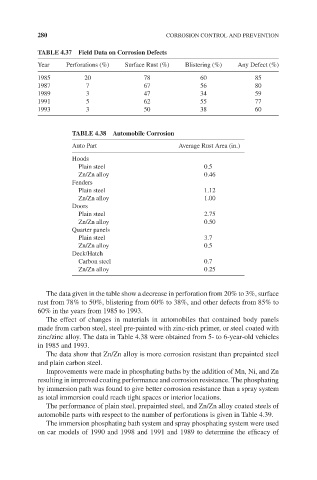
TABLE 4.37 Field Data on Corrosion Defects
Year Perforations (%) Surface Rust (%) Blistering (%) Any Defect (%)
1985 20 78 60 85
1987 7 67 56 80
1989 3 47 34 59
1991 5 62 55 77
1993 3 50 38 60
TABLE 4.38 Automobile Corrosion
Auto Part Average Rust Area (in.)
Hoods
Plain steel 0.5
Zn/Zn alloy 0.46
Fenders
Plain steel 1.12
Zn/Zn alloy 1.00
Doors
Plain steel 2.75
Zn/Zn alloy 0.50
Quarter panels
Plain steel 3.7
Zn/Zn alloy 0.5
Deck/Hatch
Carbon steel 0.7
Zn/Zn alloy 0.25
The data given in the table show a decrease in perforation from 20% to 3%, surface
rust from 78% to 50%, blistering from 60% to 38%, and other defects from 85% to
60% in the years from 1985 to 1993.
The effect of changes in materials in automobiles that contained body panels
made from carbon steel, steel pre-painted with zinc-rich primer, or steel coated with
zinc/zinc alloy. The data in Table 4.38 were obtained from 5- to 6-year-old vehicles
in 1985 and 1993.
The data show that Zn/Zn alloy is more corrosion resistant than prepainted steel
and plain carbon steel.
Improvements were made in phosphating baths by the addition of Mn, Ni, and Zn
resulting in improved coating performance and corrosion resistance. The phosphating
by immersion path was found to give better corrosion resistance than a spray system
as total immersion could reach tight spaces or interior locations.
The performance of plain steel, prepainted steel, and Zn/Zn alloy coated steels of
automobile parts with respect to the number of perforations is given in Table 4.39.
The immersion phosphating bath system and spray phosphating system were used
on car models of 1990 and 1998 and 1991 and 1989 to determine the efficacy of