
Page 344 - Challenges in Corrosion Costs Causes Consequences and Control(2015)
P. 344
322 CONSEQUENCES OF CORROSION
According to the Battelle-NBS report (1, 2, 8), the total US cost of metallic cor-
rosion was estimated to be $70 billion, which comprised 4.2% of GNP in 1975, and
15% or $10 billion was estimated to be avoidable by using the available corrosion
prevention technology. The final results based on NBS analysis of uncertainty in the
Battelle input/output model estimated the metallic corrosion cost of $82 billion or
4.9% of $1.677 trillion GNP in 1975. Nearly $33 billion or 2% of GNP was estimated
to be avoidable.
The corrosion cost analysis of four sectors, namely: (i) federal government; (ii)
personally owned automobiles; (iii) electric power industry; and (iv) energy and mate-
rial loses was done.
The agencies involved in the federal government sector were the US Department of
Defense, the National Aeronautics and Space Administration (NASA), the US Coast
Guard, the US Government Services Administration, the legislative branch, and the
National Bureau of Standards (NBS).
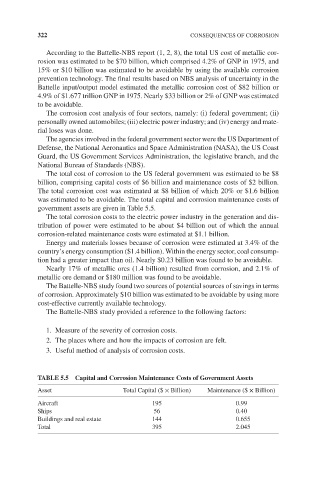
The total cost of corrosion to the US federal government was estimated to be $8
billion, comprising capital costs of $6 billion and maintenance costs of $2 billion.
The total corrosion cost was estimated at $8 billion of which 20% or $1.6 billion
was estimated to be avoidable. The total capital and corrosion maintenance costs of
government assets are given in Table 5.5.
The total corrosion costs to the electric power industry in the generation and dis-
tribution of power were estimated to be about $4 billion out of which the annual
corrosion-related maintenance costs were estimated at $1.1 billion.
Energy and materials losses because of corrosion were estimated at 3.4% of the
country’s energy consumption ($1.4 billion). Within the energy sector, coal consump-
tion had a greater impact than oil. Nearly $0.23 billion was found to be avoidable.
Nearly 17% of metallic ores (1.4 billion) resulted from corrosion, and 2.1% of
metallic ore demand or $180 million was found to be avoidable.
The Battelle-NBS study found two sources of potential sources of savings in terms
of corrosion. Approximately $10 billion was estimated to be avoidable by using more
cost-effective currently available technology.
The Battelle-NBS study provided a reference to the following factors:
1. Measure of the severity of corrosion costs.
2. The places where and how the impacts of corrosion are felt.
3. Useful method of analysis of corrosion costs.
TABLE 5.5 Capital and Corrosion Maintenance Costs of Government Assets
Asset Total Capital ($ × Billion) Maintenance ($ × Billion)
Aircraft 195 0.99
Ships 56 0.40
Buildings and real estate 144 0.655
Total 395 2.045