
Page 359 - Challenges in Corrosion Costs Causes Consequences and Control(2015)
P. 359
CORROSION DAMAGE, DEFECTS, AND FAILURES 337
Acc. V Spol Magn Del WD 100 μm
20.0 kV 1.0 200× BSE 10.0
Figure 5.11 SEM photo of intergranular pit. (Copyright of her Majesty the Queen in Right
of Canada, as represented by the Minister of Natural Resources, 2004, 2006.)
6
7
8 4
3
2
Acc. V Spol Magn Del WD 50 μm 1
20.0 kV 4.0 400x BSE 10.0
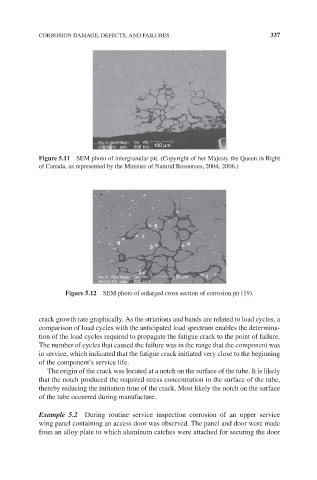
Figure 5.12 SEM photo of enlarged cross section of corrosion pit (19).
crack growth rate graphically. As the striations and bands are related to load cycles, a
comparison of load cycles with the anticipated load spectrum enables the determina-
tion of the load cycles required to propagate the fatigue crack to the point of failure.
The number of cycles that caused the failure was in the range that the component was
in service, which indicated that the fatigue crack initiated very close to the beginning
of the component’s service life.
The origin of the crack was located at a notch on the surface of the tube. It is likely
that the notch produced the required stress concentration in the surface of the tube,
thereby reducing the initiation time of the crack. Most likely the notch on the surface
of the tube occurred during manufacture.
Example 5.2 During routine service inspection corrosion of an upper service
wing panel containing an access door was observed. The panel and door were made
from an alloy plate to which aluminum catches were attached for securing the door