
Page 140 - Chiral Separation Techniques
P. 140
4.6 Dealing with Molecular Similarity 117
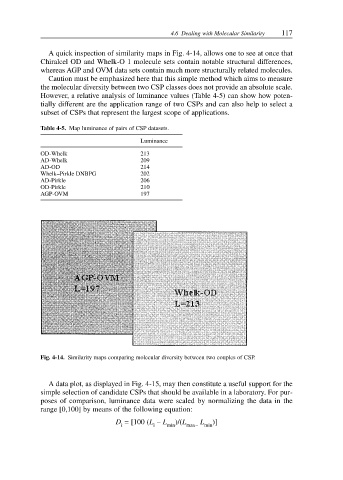
A quick inspection of similarity maps in Fig. 4-14, allows one to see at once that
Chiralcel OD and Whelk-O 1 molecule sets contain notable structural differences,
whereas AGP and OVM data sets contain much more structurally related molecules.
Caution must be emphasized here that this simple method which aims to measure
the molecular diversity between two CSP classes does not provide an absolute scale.
However, a relative analysis of luminance values (Table 4-5) can show how poten-
tially different are the application range of two CSPs and can also help to select a
subset of CSPs that represent the largest scope of applications.
Table 4-5. Map luminance of pairs of CSP datasets.
Luminance
OD-Whelk 213
AD-Whelk 209
AD-OD 214
Whelk–Pirkle DNBPG 202
AD-Pirkle 206
OD-Pirkle 210
AGP-OVM 197
Fig. 4-14. Similarity maps comparing molecular diversity between two couples of CSP.
A data plot, as displayed in Fig. 4-15, may then constitute a useful support for the
simple selection of candidate CSPs that should be available in a laboratory. For pur-
poses of comparison, luminance data were scaled by normalizing the data in the
range [0,100] by means of the following equation:
D = [100 (L – L )/(L L )]
i i min max– min