
Page 138 - Chiral Separation Techniques
P. 138
4.6 Dealing with Molecular Similarity 115
Similarity Scale
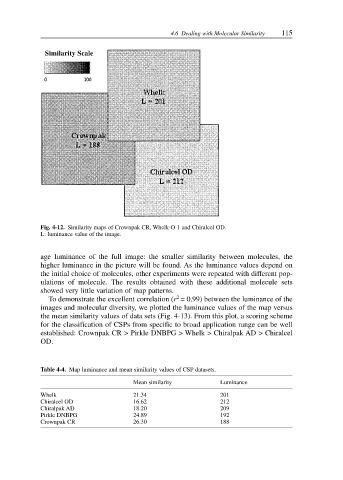
Fig. 4-12. Similarity maps of Crownpak CR, Whelk-O 1 and Chiralcel OD.
L: luminance value of the image.
age luminance of the full image: the smaller similarity between molecules, the
higher luminance in the picture will be found. As the luminance values depend on
the initial choice of molecules, other experiments were repeated with different pop-
ulations of molecule. The results obtained with these additional molecule sets
showed very little variation of map patterns.
2
To demonstrate the excellent correlation (r = 0.99) between the luminance of the
images and molecular diversity, we plotted the luminance values of the map versus
the mean similarity values of data sets (Fig. 4-13). From this plot, a scoring scheme
for the classification of CSPs from specific to broad application range can be well
established: Crownpak CR > Pirkle DNBPG > Whelk > Chiralpak AD > Chiralcel
OD.
Table 4-4. Map luminance and mean similarity values of CSP datasets.
Mean similarity Luminance
Whelk 21.34 201
Chiralcel OD 16.62 212
Chiralpak AD 18.20 209
Pirkle DNBPG 24.89 192
Crownpak CR 26.30 188