
Page 250 - Chiral Separation Techniques
P. 250
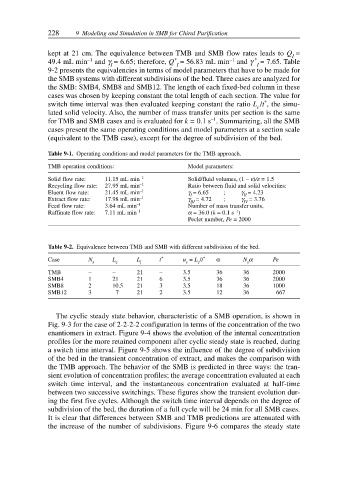
228     9 Modeling and Simulation in SMB for Chiral Purification


               kept at 21 cm. The equivalence between TMB and SMB flow rates leads to Q =
                                                                                    I
                                                  *
               49.4 mL min –1  and γ = 6.65; therefore, Q = 56.83 mL min –1  and γ *  = 7.65. Table
                                I                  I                      I
               9-2 presents the equivalencies in terms of model parameters that have to be made for
               the SMB systems with different subdivisions of the bed. Three cases are analyzed for
               the SMB: SMB4, SMB8 and SMB12. The length of each fixed-bed column in these
               cases was chosen by keeping constant the total length of each section. The value for
                                                                            *
               switch time interval was then evaluated keeping constant the ratio L /t , the simu-
                                                                          c
               lated solid velocity. Also, the number of mass transfer units per section is the same
                                                             –1
               for TMB and SMB cases and is evaluated for k = 0.1 s . Summarizing, all the SMB
               cases present the same operating conditions and model parameters at a section scale
               (equivalent to the TMB case), except for the degree of subdivision of the bed.
               Table 9-1. Operating conditions and model parameters for the TMB approach.
               TMB operation conditions:              Model parameters:
               Solid flow rate:  11.15 mL min –1      Solid/fluid volumes, (1 – ε)/ε = 1.5
               Recycling flow rate:  27.95 mL min –1  Ratio between fluid and solid velocities:
               Eluent flow rate:  21.45 mL min –1     γ = 6.65  ;    γ = 4.23
                                                                      II
                                                       I
               Extract flow rate:  17.98 mL min –1    γ = 4.72  ;    γ = 3.76
                                                       III
                                                                      IV
               Feed flow rate:  3.64 mL min –1        Number of mass transfer units,
                                                                   –1
               Raffinate flow rate:  7.11 mL min –1   α = 36.0 (k = 0.1 s )
                                                      Peclet number, Pe = 2000
               Table 9-2. Equivalence between TMB and SMB with different subdivision of the bed.
               Case       N      L      L     t *    u = L /t *  α    N α     Pe
                           s      c      j            s  c             s
               TMB        –      –      21    –      3.5      36      36      2000
               SMB4       1      21     21    6      3.5      36      36      2000
               SMB8       2      10.5   21    3      3.5      18      36      1000
               SMB12      3       7     21    2      3.5      12      36       667


                 The cyclic steady state behavior, characteristic of a SMB operation, is shown in
               Fig. 9-3 for the case of 2-2-2-2 configuration in terms of the concentration of the two
               enantiomers in extract. Figure 9-4 shows the evolution of the internal concentration
               profiles for the more retained component after cyclic steady state is reached, during
               a switch time interval. Figure 9-5 shows the influence of the degree of subdivision
               of the bed in the transient concentration of extract, and makes the comparison with
               the TMB approach. The behavior of the SMB is predicted in three ways: the tran-
               sient evolution of concentration profiles; the average concentration evaluated at each
               switch time interval, and the instantaneous concentration evaluated at half-time
               between two successive switchings. These figures show the transient evolution dur-
               ing the first five cycles. Although the switch time interval depends on the degree of
               subdivision of the bed, the duration of a full cycle will be 24 min for all SMB cases.
               It is clear that differences between SMB and TMB predictions are attenuated with
               the increase of the number of subdivisions. Figure 9-6 compares the steady state