
Page 263 - Chiral Separation Techniques
P. 263
9.5 The Steady State TMB Model 241
C
γ = 7.135 +γ –γ and, since K = 4.03, the critical value for γ is γ >γ = 6.045.
I II III B I I I
As we concluded earlier, γ is constant along a straight line parallel to the diagonal
I
γ = γ . Furthermore, γ diminishes as this straight line moves away from the diag-
III II I
onal γ = γ . Also, the vertex of the complete separation region is the furthest point
III II
from the diagonal and corresponds to the optimal conditions, because both solvent
consumption and adsorbent productivity are optimized. This vertex point corre-
sponds also to the lower value for γ in the complete separation region.
I
–1
The vertex of the complete separation region, evaluated for k = 0.5 s , is charac-
terized by γ = 3.86 and γ = 4.75. The corresponding minimum value of γ is γ =
II III I I
C
7.135 + 3.86 – 4.75 = 6.245, which is still higher than the critical value γ = 6.045.
I
We conclude that, considering negligible mass transfer, within the whole separation
region built under these conditions, the γ value does not affect the SMB perfor-
I
mance. It should be pointed out that the presence of mass transfer resistance can
influence the critical value for γ and the form of the separation region [32].
I
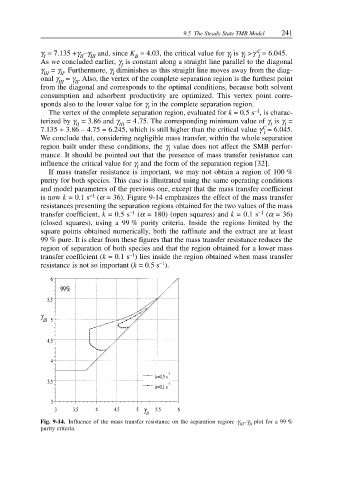
If mass transfer resistance is important, we may not obtain a region of 100 %
purity for both species. This case is illustrated using the same operating conditions
and model parameters of the previous one, except that the mass transfer coefficient
is now k = 0.1 s –1 (α = 36). Figure 9-14 emphasizes the effect of the mass transfer
resistances presenting the separation regions obtained for the two values of the mass
transfer coefficient, k = 0.5 s –1 (α = 180) (open squares) and k = 0.1 s –1 (α = 36)
(closed squares), using a 99 % purity criteria. Inside the regions limited by the
square points obtained numerically, both the raffinate and the extract are at least
99 % pure. It is clear from these figures that the mass transfer resistance reduces the
region of separation of both species and that the region obtained for a lower mass
–1
transfer coefficient (k = 0.1 s ) lies inside the region obtained when mass transfer
–1
resistance is not so important (k = 0.5 s ).
Fig. 9-14. Influence of the mass transfer resistance on the separation region: γ –γ plot for a 99 %
III
II
purity criteria.