
Page 300 - Chiral Separation Techniques
P. 300
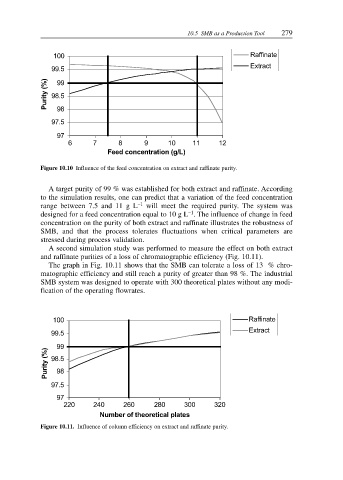
10.5 SMB as a Production Tool  279


                100                                                     Raffinate
                                                                        Extract
                99.5
              Purity (%)  98.5
                 99


                 98
                97.5

                 97
                    6      7       8      9      10     11     12
                                Feed concentration (g/L)

             Figure 10.10 Influence of the feed concentration on extract and raffinate purity.


               A target purity of 99 % was established for both extract and raffinate. According
             to the simulation results, one can predict that a variation of the feed concentration
             range between 7.5 and 11 g L –1  will meet the required purity.  The system was
                                                      –1
             designed for a feed concentration equal to 10 g L . The influence of change in feed
             concentration on the purity of both extract and raffinate illustrates the robustness of
             SMB, and that the process tolerates fluctuations when critical parameters are
             stressed during process validation.
               A second simulation study was performed to measure the effect on both extract
             and raffinate purities of a loss of chromatographic efficiency (Fig. 10.11).
               The graph in Fig. 10.11 shows that the SMB can tolerate a loss of 13 % chro-
             matographic efficiency and still reach a purity of greater than 98 %. The industrial
             SMB system was designed to operate with 300 theoretical plates without any modi-
             fication of the operating flowrates.


                100                                                     Raffinate
                                                                        Extract
                99.5
                 99
              Purity (%)  98.5

                 98

                97.5
                 97
                   220     240      260      280     300      320
                             Number of theoretical plates
             Figure 10.11. Influence of column efficiency on extract and raffinate purity.