Page 47 - Circuit Analysis II with MATLAB Applications
P. 47

Other Second Order Circuits


                                                                                   t
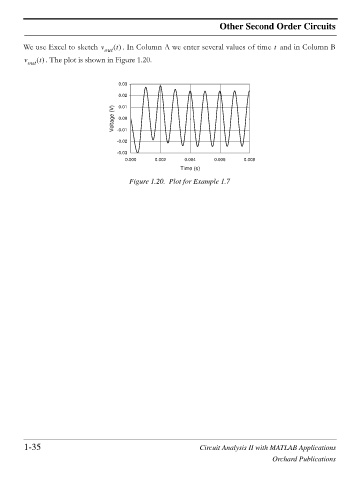
        We use Excel to sketch v out  t    . In Column A we enter several values of time   and in Column B
        v out  t    . The plot is shown in Figure 1.20.


                                     0.03
                                     0.02

                                     0.01
                                   Voltage (V)  -0.01
                                     0.00


                                    -0.02
                                    -0.03
                                       0.000    0.002   0.004    0.006    0.008
                                                       Time (s)
                                        Figure 1.20. Plot for Example 1.7


        1-35                                                 Circuit Analysis II with MATLAB Applications
                                                                                   Orchard Publications
   42   43   44   45   46   47   48   49   50   51   52