
Page 200 - Classification Parameter Estimation & State Estimation An Engg Approach Using MATLAB
P. 200
CRITERIA FOR SELECTION AND EXTRACTION 189
scatter diagram
within-class and between-class scatter matrices
1
0.5
0.8 s b s b
0.6
0
0.4 s w
0.2
–0.5
0
0 0.2 0.4 0.6 0.8 1
–0.5 0 0.5
after decorrelation
after whitening and decorrelation
0.5
s b
s b
1 s
0 0 w
s w
–1
–0.5
–0.5 0 0.5 –1 0 1
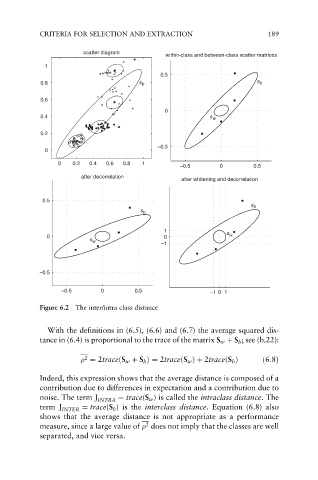
Figure 6.2 The inter/intra class distance
With the definitions in (6.5), (6.6) and (6.7) the average squared dis-
tance in (6.4) is proportional to the trace of the matrix S w þ S b ; see (b.22):
2
¼ 2traceðS w þ S b Þ¼ 2traceðS w Þþ 2traceðS b Þ ð6:8Þ
Indeed, this expression shows that the average distance is composed of a
contribution due to differences in expectation and a contribution due to
noise. The term J INTRA ¼ trace(S w ) is called the intraclass distance. The
term J INTER ¼ trace(S b ) is the interclass distance. Equation (6.8) also
shows that the average distance is not appropriate as a performance
2
measure, since a large value of does not imply that the classes are well
separated, and vice versa.