
Page 241 - Classification Parameter Estimation & State Estimation An Engg Approach Using MATLAB
P. 241
230 UNSUPERVISED LEARNING
shortest distance from any object in one cluster to any object in the
other cluster:
2
d sl ðC i ; C j Þ¼ min kx yk ð7:11Þ
x2C i ;y2C j
For average-link clustering, the minimum operator is replaced by the
average distance, and for the complete-link clustering it is replaced by
the maximum operator.
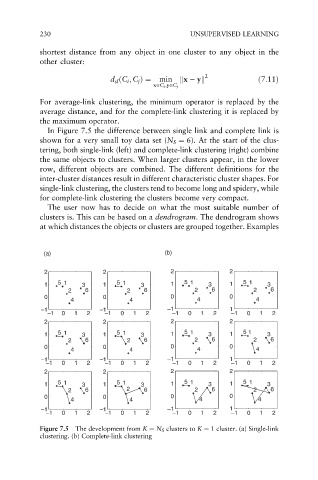
In Figure 7.5 the difference between single link and complete link is
shown for a very small toy data set (N S ¼ 6). At the start of the clus-
tering, both single-link (left) and complete-link clustering (right) combine
the same objects to clusters. When larger clusters appear, in the lower
row, different objects are combined. The different definitions for the
inter-cluster distances result in different characteristic cluster shapes. For
single-link clustering, the clusters tend to become long and spidery, while
for complete-link clustering the clusters become very compact.
The user now has to decide on what the most suitable number of
clusters is. This can be based on a dendrogram. The dendrogram shows
at which distances the objects or clusters are grouped together. Examples
(a) (b)
2 2 2 2
1 5 1 3 1 5 1 3 1 5 1 3 1 5 1 3
2 6 2 6 2 6 2 6
0 0 0 0
4 4 4 4
–1 –1 –1 1
–1 0 1 2 –1 0 1 2 –1 0 1 2 –1 0 1 2
2 2 2 2
1 5 1 3 1 5 1 3 1 5 1 3 1 5 1 3
2 6 2 6 2 6 2 6
0 0 0 0
4 4 4 4
–1 –1 –1 1
–1 0 1 2 –1 0 1 2 –1 0 1 2 –1 0 1 2
2 2 2 2
1 5 1 3 1 5 1 3 1 5 1 3 1 5 1 3
2 6 2 6 2 6 2 6
0 0 0 0
4 4 4 4
–1 –1 –1 1
–1 0 1 2 –1 0 1 2 –1 0 1 2 –1 0 1 2
Figure 7.5 The development from K ¼ N S clusters to K ¼ 1 cluster. (a) Single-link
clustering. (b) Complete-link clustering