
Page 244 - Classification Parameter Estimation & State Estimation An Engg Approach Using MATLAB
P. 244
CLUSTERING 233
6
5
4
3
2
1
0
–1
–2 –1 0 1 2 3 4
Figure 7.7 The development of the cluster means during 10 update steps of the
K-means algorithm
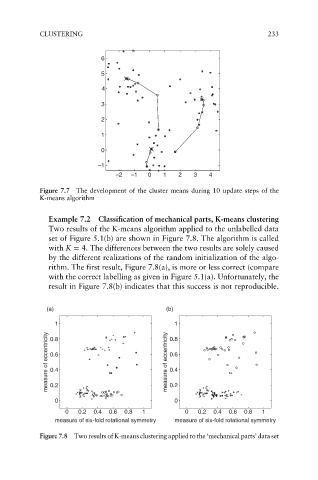
Example 7.2 Classification of mechanical parts, K-means clustering
Two results of the K-means algorithm applied to the unlabelled data
set of Figure 5.1(b) are shown in Figure 7.8. The algorithm is called
with K ¼ 4. The differences between the two results are solely caused
by the different realizations of the random initialization of the algo-
rithm. The first result, Figure 7.8(a), is more or less correct (compare
with the correct labelling as given in Figure 5.1(a). Unfortunately, the
result in Figure 7.8(b) indicates that this success is not reproducible.
(a) (b)
1 0.8 1
measure of eccentricity 0.6 measure of eccentricity 0.6
0.8
0.4
0.4
0.2
0 0.2 0
0 0.2 0.4 0.6 0.8 1 0 0.2 0.4 0.6 0.8 1
measure of six-fold rotational symmetry measure of six-fold rotational symmetry
Figure 7.8 Two results of K-means clustering applied to the ‘mechanical parts’ data set