
Page 256 - Classification Parameter Estimation & State Estimation An Engg Approach Using MATLAB
P. 256
CLUSTERING 245
the data well. The retrieved data reduction will therefore not reflect the
true structure in the data and visual inspection only reveals an artificially
induced structure. Training several SOMs with different settings might
provide some stable solution.
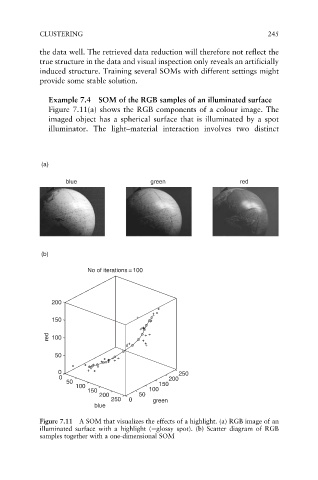
Example 7.4 SOM of the RGB samples of an illuminated surface
Figure 7.11(a) shows the RGB components of a colour image. The
imaged object has a spherical surface that is illuminated by a spot
illuminator. The light–material interaction involves two distinct
(a)
blue green red
(b)
No of iterations = 100
200
150
red 100
50
0 250
0 200
50 150
100
150 100
200 50
250 0 green
blue
Figure 7.11 A SOM that visualizes the effects of a highlight. (a) RGB image of an
illuminated surface with a highlight (¼glossy spot). (b) Scatter diagram of RGB
samples together with a one-dimensional SOM