
Page 15 -
P. 15
2.4 Regressions
To determine the effect of factors of interest (§2.2) on the commercial and technical
impact of patents, we estimated long-tailed [33] Poisson models of citation counts and
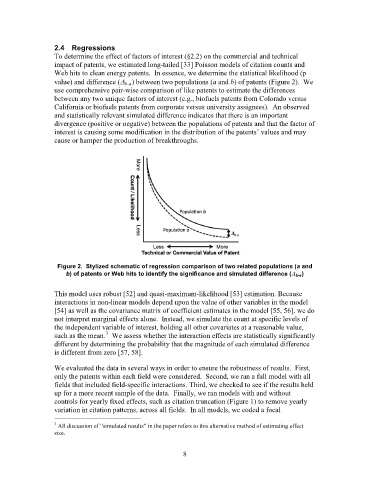
Web hits to clean energy patents. In essence, we determine the statistical likelihood (p
value) and difference (∆ b-a) between two populations (a and b) of patents (Figure 2). We
use comprehensive pair-wise comparison of like patents to estimate the differences
between any two unique factors of interest (e.g., biofuels patents from Colorado versus
California or biofuels patents from corporate versus university assignees). An observed
and statistically relevant simulated difference indicates that there is an important
divergence (positive or negative) between the populations of patents and that the factor of
interest is causing some modification in the distribution of the patents’ values and may
cause or hamper the production of breakthroughs.
Figure 2. Stylized schematic of regression comparison of two related populations (a and
b) of patents or Web hits to identify the significance and simulated difference (∆ b-a )
This model uses robust [52] and quasi-maximum-likelihood [53] estimation. Because
interactions in non-linear models depend upon the value of other variables in the model
[54] as well as the covariance matrix of coefficient estimates in the model [55, 56], we do
not interpret marginal effects alone. Instead, we simulate the count at specific levels of
the independent variable of interest, holding all other covariates at a reasonable value,
3
such as the mean. We assess whether the interaction effects are statistically significantly
different by determining the probability that the magnitude of each simulated difference
is different from zero [57, 58].
We evaluated the data in several ways in order to ensure the robustness of results. First,
only the patents within each field were considered. Second, we ran a full model with all
fields that included field-specific interactions. Third, we checked to see if the results held
up for a more recent sample of the data. Finally, we ran models with and without
controls for yearly fixed effects, such as citation truncation (Figure 1) to remove yearly
variation in citation patterns, across all fields. In all models, we coded a focal
3 All discussion of “simulated results” in the paper refers to this alternative method of estimating effect
size.
8